Home Blog Page 58

Where to Look and How to Choose a Provider

0
Where to Look and How to Choose a Provider

Key Takeaways

  • A cheap price doesn’t always mean it’s the best deal for you, as you want to consider the provider’s ratings and more before switching.
  • The lowest energy rates may not mean a company is the cheapest energy provider in Dallas, as incentives and other factors may make a provider with higher rates cheaper.
  • Saving on electricity goes well beyond just getting cheap energy rates. You can also lower your energy usage, further reducing your bills.

With unsettled energy rates, Dallas residents are always looking for ways to save on their electricity bills. Fortunately, Texas is a deregulated energy market, so you are free to choose your energy provider. Whether you’re a budget-conscious individual or a family trying to manage expenses, finding cheap electricity in Dallas that meets your needs is crucial.

Below, we’ll explore various tips, factors to consider, government assistance programs, and other ways to help you secure cheap electricity in Dallas. So let’s dive in and discover the secrets to reducing your electricity costs.

How Can I Find the Cheapest Electricity Rates in Dallas?

Knowledge is power when finding the cheapest electricity rates in Dallas. Look for electricity providers with competitive rates and great customer service. By comparing rates from multiple providers, you can make an informed decision based on your specific needs.

Manually finding each energy provider’s rates can be tedious, but using online comparison tools, such as Power to Choose, can streamline the process. These online tools handle the legwork and display various electricity plans side by side, so you can easily compare rates, contract length terms, and additional fees before committing.

Keep in mind that the best electricity rates may not always be the best option for you. Other factors you want to consider when choosing an energy provider include:

  • Customer reviews: Finding a great Dallas electricity plan means nothing if the provider has poor reviews due to shady practices, poor customer service, billing issues, and other problems. So, finding a Dallas electricity provider with great online reviews is paramount.
  • Customer service: When you have an issue, you want to know your power company is there to help. So, finding a residential electricity provider with accessible customer service is critical. Make sure to check that they have a toll-free number and look up their hours of operation to ensure you can easily communicate with them at all times.
  • Contract terms: Understand the term length, all the plan details, and any early termination fees that may apply.
  • Special incentive: Keep an eye out for special incentives that sweeten the pot, such as bill credits for switching, free nights, and more.

You also need to understand the types of electricity plans available in Dallas. Some Texas electricity companies have fixed-rate plans, where the rate remains constant throughout the contract. Fixed-rate electricity plans provide stable and predictable monthly bills.

The other option is a variable-rate plan, which fluctuates based on market conditions. These plans offer potential savings when energy prices are low, but they pose the risk of higher bills during peak seasons or if rates suddenly increase.

Another important consideration when hunting for the best electricity plan is your energy company’s environmental impact. Some Dallas electricity companies offer green energy plans sourced from renewable energy sources like wind or solar power. When you choose a green energy plan, you’re helping reduce your carbon footprint and supporting sustainable energy practices in the Dallas area.

Are There Any Tips for Reducing Energy Costs in Dallas?

reducing energy costs in dallas outlet to plug

Finding cheap electricity in Dallas is one way to lower your overall electricity bill, but you can further reduce your costs by regulating your monthly usage.

Conducting a home energy audit is one effective way to reduce electricity use, which can help you identify areas where you’re wasting energy and provide solutions to address these inefficiencies. Some utility companies offer free or discounted energy audits, so always ask about this service when shopping for a new Dallas energy provider.

Here are some other ways you can proactively reduce your energy costs:

  • Invest in energy-efficient appliances: Upgrading from older appliances with high energy needs to newer, more energy-efficient appliances may require an initial investment, but it pays off over time. When shopping for new appliances, look for products with the Energy Star label, which are designed to consume less energy.
  • Unplug electronics when not in use: Many devices draw power even when they’re turned off. Habitually unplug electronics or use power strips you can easily switch off when not in use to reduce the idle power drain.
  • Maintain your HVAC system: Regular heating, ventilation, and air conditioning (HVAC) system maintenance helps it operate more efficiently. Clean or replace air filters regularly and consider installing a programmable thermostat to optimize energy usage.
  • Seal windows and doors: Air leaks can significantly impact your energy consumption. Installing weatherstripping or caulking around windows and doors prevents drafts and helps keep your home energy-efficient. In fact, you can save up to 15% on heating and cooling costs just by ensuring your home is well-sealed.
  • Take advantage of natural light: Open curtains and blinds during the day to use natural light to illuminate your home. This reduces the need for artificial lighting and can lower your electricity usage.
  • Adjust your water heater temperature: Lowering your water heater temperature can result in substantial energy savings. You should target around 120 degrees Fahrenheit and consider insulating your water heater to minimize heat loss. This can save you $36 to $61 per year compared to setting it at 140 degrees.
Find out why over half a million Texans trust Just Energy!

Find out why over half a million Texans trust Just Energy!

Are There Government Assistance Programs or Incentives to Reduce Electricity Costs in Dallas?

Yes, Dallas has government assistance programs to support people struggling with electricity costs.

The Low-Income Home Energy Assistance Program (LIHEAP) offers low-income households financial assistance to help cover their energy bills. This program can also help in an energy crisis and with weatherization and energy-related household repairs. It’s worth researching the eligibility criteria and application process to see if you qualify for this program.

Some electricity providers offer homeowners incentives or rebates for energy-efficient upgrades or participation in energy-saving programs. Check with your provider or explore online resources for any available programs that can further reduce your electricity costs.

Texas also offers tax credits at a state level, including 30% (up to $600) of the cost to install an energy-efficient air conditioner or heating system.

Finally, Texas has initiatives to promote renewable energy sources, such as solar and wind power. By investing in solar panels, solar water heaters, and wind turbines for your home, you may be eligible for a tax credit worth up to 30% of the cost of installing these systems.

Can Time-of-Use or Off-Peak Electricity Plans Save Money?

Yes, time-of-use or off-peak electricity plans can help save money on your electricity bill. These plans offer lower rates during specific times of the day when overall energy demand is lower. By managing your energy usage to leverage off-peak hours, you can maximize savings.

However, you want to consider your household’s energy consumption habits before selecting a time-of-use plan. If you use the most energy during peak hours, this plan may require significant shifts in your daily routine to see any savings.

For example, you may have to shift the running major appliances, such as washing machines, dryers, and dishwashers, to off-peak times to see significant savings over time. If your household can commit to these changes, then you’re a great fit. But if you have any doubts about making these changes, you may want to stick with a fixed-rate plan.

It’s also worth noting that you may be able to find service providers offering incentives or rebates for customers who enroll in time-of-use plans. These incentives may make it worthwhile to switch to a time-of-use electricity plan. Check with prospective utility providers about additional benefits they can offer by opting for a time-of-use plan.

What Are the Average Electricity Rates in Dallas?

Electricity rates in Dallas vary depending on your energy consumption, chosen electricity plan, and more. When hunting for cheap electricity in Dallas, it’s always a good idea to know what the average rates are as a jumping-off point.

As of August 2024, the average Dallas electricity rate is 13.6 cents per kilowatt-hour (kWh). Your actual electricity prices will vary.

What Are the Best Strategies for Budget-Friendly Electricity Usage in Dallas?

electricity usage in dallas woman reviews bill

Energy usage plays a huge role in saving on energy costs in Dallas. Some budget-friendly electricity usage strategies include:

  • Be mindful of peak hours: Understand when electricity rates are higher and limit your energy consumption during those times.
  • Practice energy conservation: Turn off lights when leaving a room, unplug chargers after use, and make conscious efforts to conserve energy in your daily routines.
  • Keep track of your energy usage: Monitor your electricity usage regularly to identify any unusual spikes or areas where you can further reduce consumption.
  • Explore energy-saving technologies: Consider investing in technologies like smart thermostats or smart power strips to help monitor and control your energy usage more efficiently.

How Do I Avoid Common Pitfalls When Searching for Cheap Electricity in Dallas?

Shopping for cheap electricity service in Dallas isn’t always straightforward, and you can run into a few pitfalls along the way. Some of the more common pitfalls to avoid include:

    • Not thoroughly reading the terms and conditions of an electricity plan: Pay close attention to the contract terms, rates, fees, and any potential penalties. Read the terms in full and ask questions about anything you’re unsure of or don’t understand.
    • Overlooking customer reviews and ratings: Give yourself ample time to research the provider’s reputation, customer service, and overall customer satisfaction. You don’t want to sign up for a new provider that ends up being a nightmare to deal with.
    • Failing to consider your energy consumption habits: Some people will impulsively choose a time-of-use plan because the lowest rate is cheap. But if you don’t understand your energy usage patterns, you may not realize you’ll never maximize the potential savings. Always review your usage patterns when considering a time-of-use electricity plan.
  • Not exploring all available options: Don’t settle for the first cheap plan you come across. Compare rates and offerings from multiple providers to secure the best deal.

Switch Plans Anytime, With Zero Fees

Say goodbye to restrictions and hello to freedom. Switch your plan anytime, at zero cost, and discover the perfect energy fit for your lifestyle.

Finding Cheap Electricity Is Just One Step Toward Lower Energy Bills

finding cheap electricity family enjoys savings at home

While finding cheap electricity in Dallas is a big step toward minimizing your electricity bill, it’s only one step. You must also consider a wide range of other factors, such as provider reputation, ratings and reliability, and your household energy usage.

With these insights, you’re equipped to navigate the world of Dallas’s deregulated electricity market and make an informed decision. Check out what great electricity rates you can get in Dallas online at Just Energy.

Brought to you by justenergy.com

All images licensed from Adobe Stock


Top-cited authors from China discuss the importance of citation metrics – Physics World

0
Top-cited authors from China discuss the importance of citation metrics – Physics World


Top-cited authors from China discuss the importance of citation metrics – Physics World


Skip to main content


Top-cited authors from China discuss the importance of citation metrics – Physics World

Discover more from Physics World


Copyright © 2024 by IOP Publishing Ltd and individual contributors

Gestamp: Turning Challenges into Opportunities—Sustainable Advances in the Manufacturing Industry

0
Gestamp: Turning Challenges into Opportunities—Sustainable Advances in the Manufacturing Industry

In pursuit of continuous process improvement, Gestamp has embraced recent recommendations we presented on integrating stamping and assembly processes solutions. In collaboration with the BIW Gestamp Design team, we hosted two webinars that brought together teams overseeing each plant. These sessions demonstrated the profits and results achieved by each team through the application of our software. Additionally, we sought to provide insights to improve internal processes.

During the webinars, we prioritized knowledge sharing and the introduction of tools applicable across different facilities. The goal was to ensure that each production unit grasped how the presented solutions could be adapted to improve their operations, promoting a more comprehensive understanding of potential implementations and their impactful results.

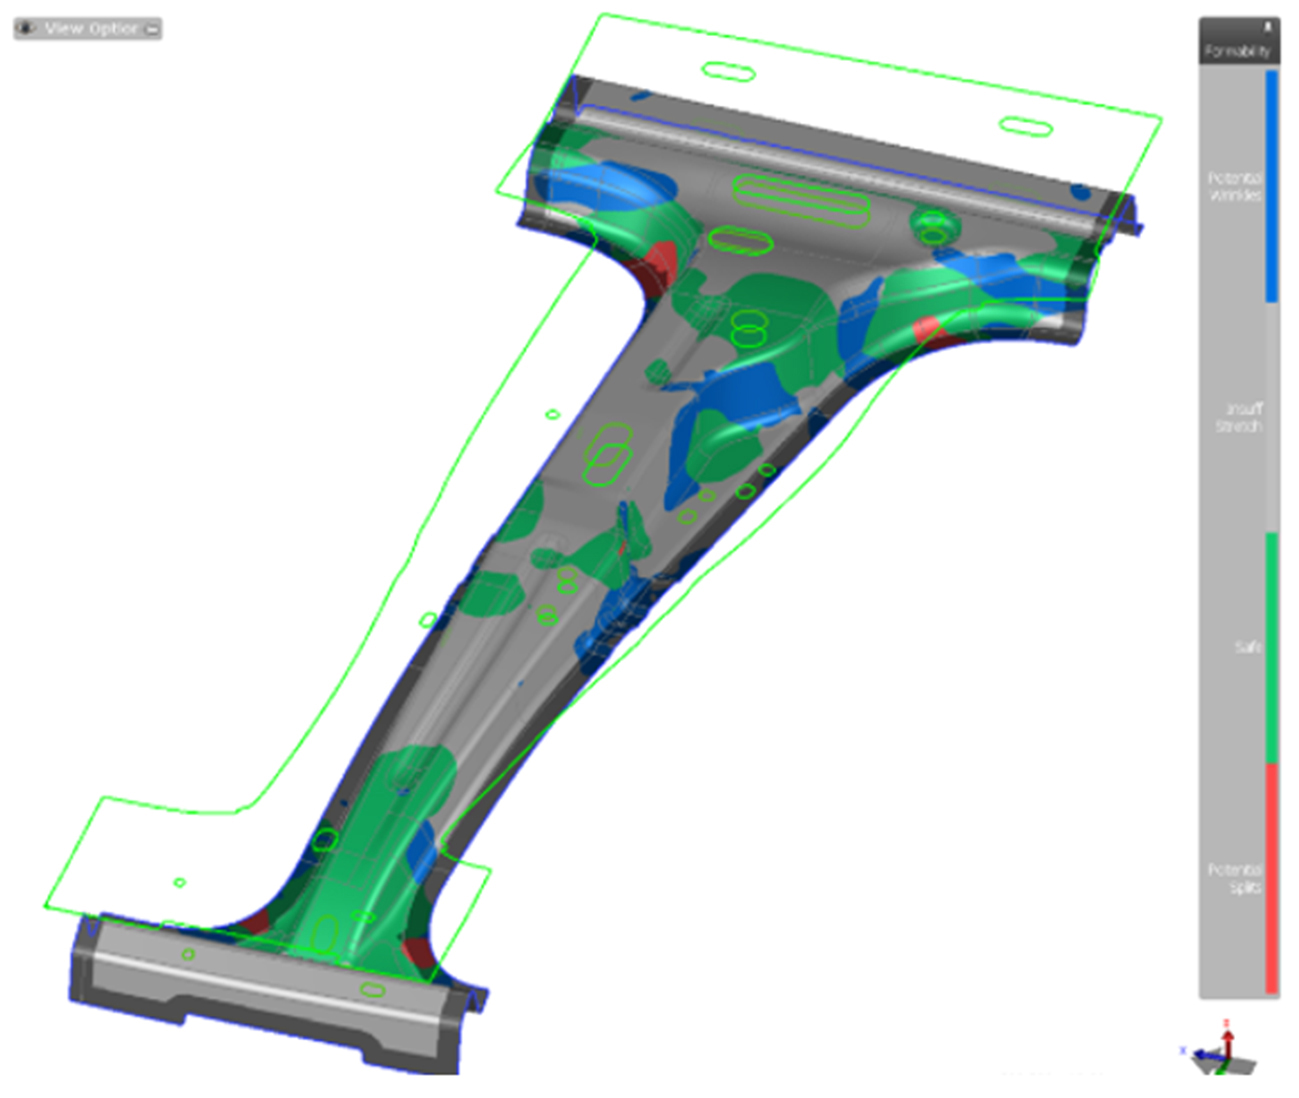
The first webinar focused on the Digital Twin process, illustrating how simulation is used throughout the development cycle of a stamped part, from product engineering to tool construction approval. A critical first step is to evaluate the formability of the product, as shown in Figure 1. This stage allows users to quickly analyze the imported data for part geometry, material data, and the optimal stamping balance. The software provides feasibility analysis tools that suggest modifications to the product geometry to mitigate specific issues, minimizing rework and future delays.

Gestamp: Turning Challenges into Opportunities—Sustainable Advances in the Manufacturing Industry

Figure 1: Product feasibility analysis

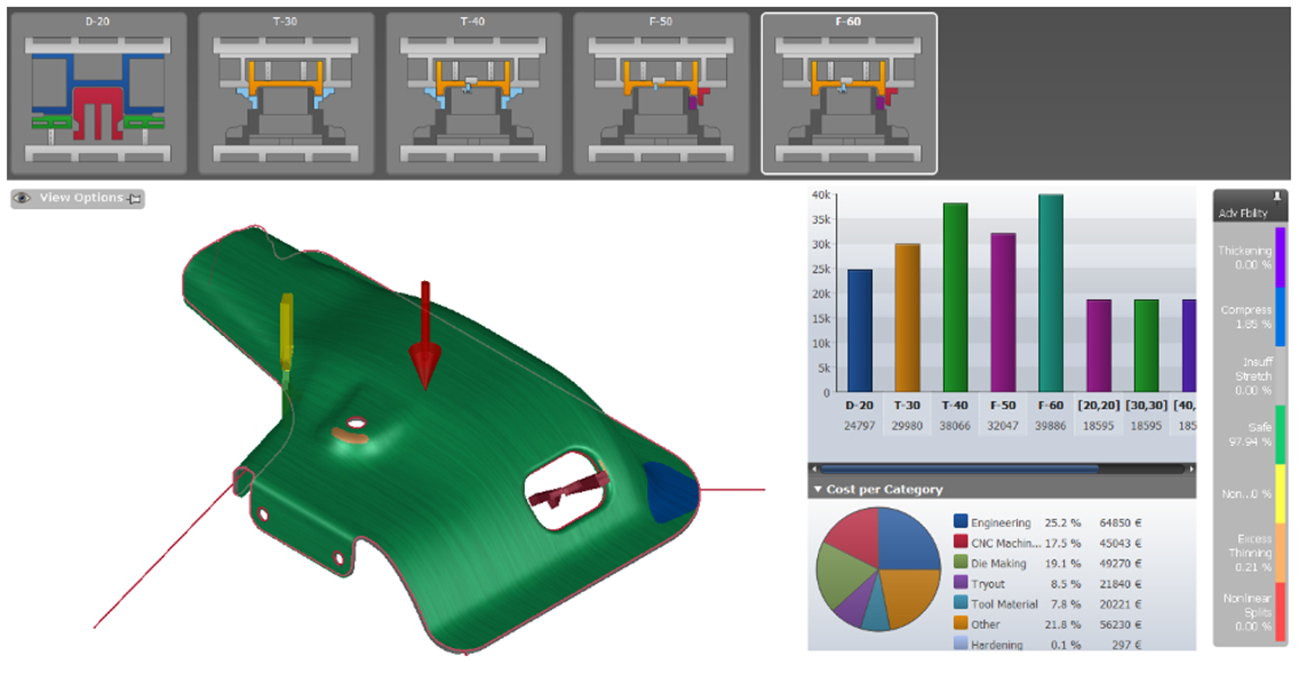
Following this evaluation, the next step is to develop the process and estimate the cost to manufacture the tooling. By parameterizing the stamping processes—whether tandem, transfer or progressive—the geometry to be developed should clearly defined at this stage. This data will inform the sizing of the blanks and components within the chosen process, as shown in Figure 2. Following these analyses, it becomes feasible to organize operations, determining the number of stamping stages required and their distribution within each operation.

Figure 2: Process development and budget

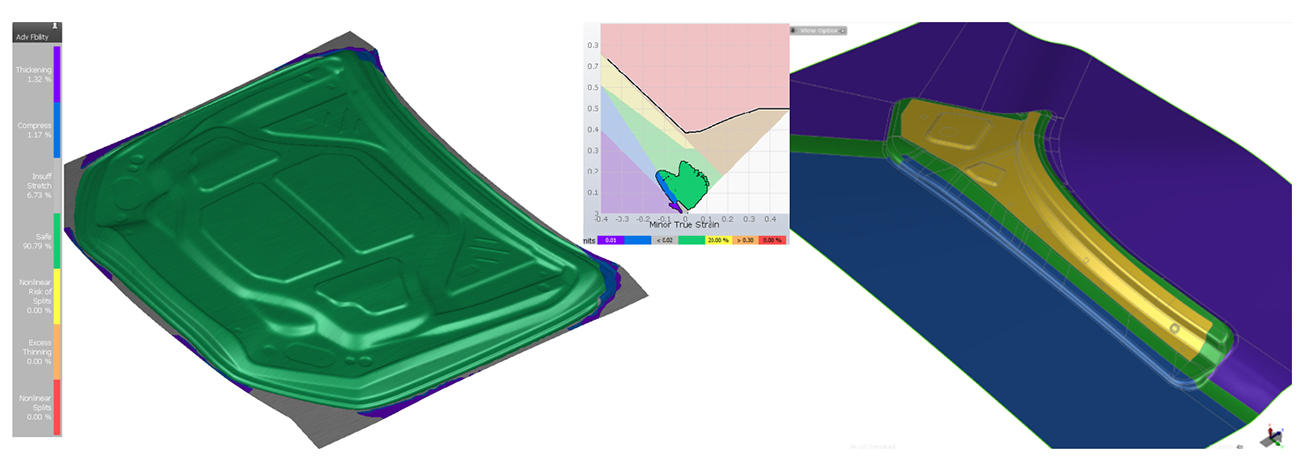
After the process validation and cost analysis associated with the tooling construction, the next stage involves evaluating the performance of the previously defined process. The software provides tools to facilitate automatic variations, such as altering the height of segmented stretchers, drawing wall inclinations, punch and die entrance radii, pressure, size, and position of the blank. In this phase, feasibility evaluation is crucial, as are compensations for the material’s springback, as shown in Figure 3. After these stages are validated, the next step is the tooling design.

Figure 3: Project and compensation

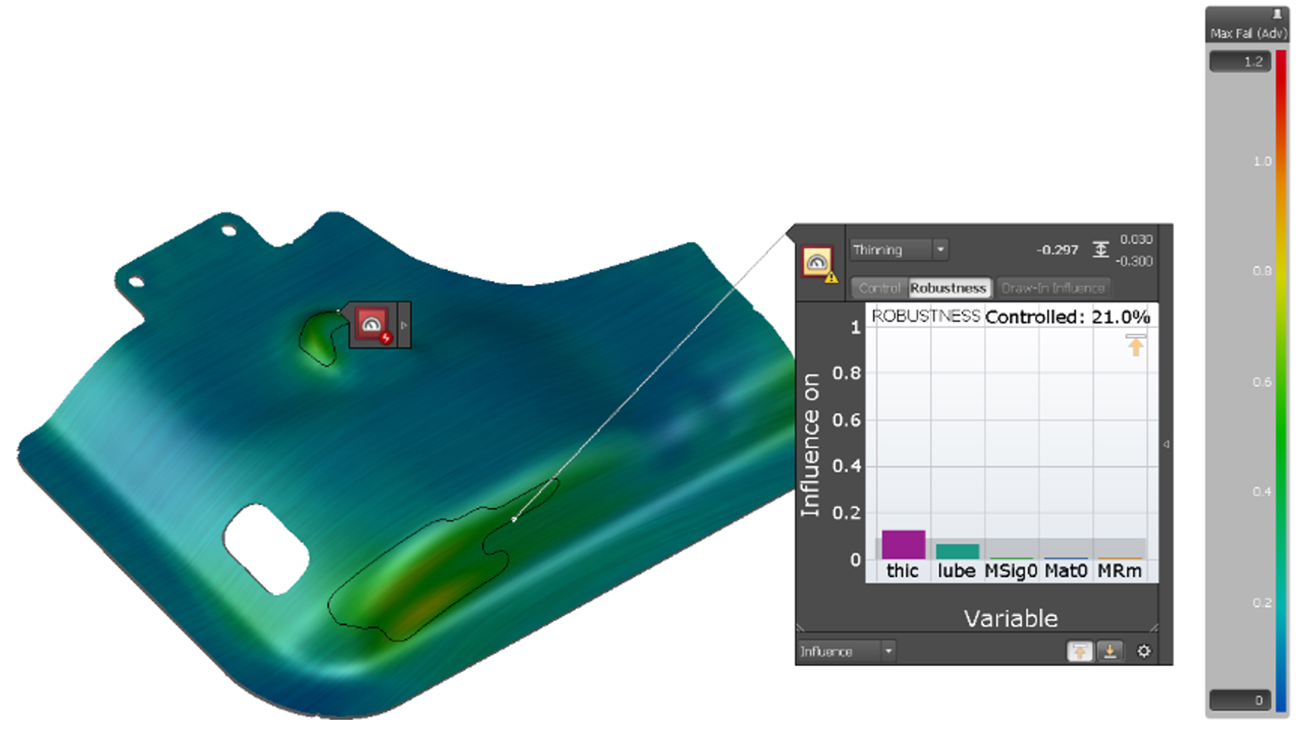
As the engineering progresses from development to the release of tooling for construction, several factors can significantly affect the stability of the production process. Variations in the material’s mechanical properties, including its thickness, can pose challenges. Leveraging the software’s features, we can integrate all established tolerances to ensure assertive results directly in production. When changes in the raw material occur, the software quickly identifies the source of any issues, thereby reducing downtime in the press lines. Through robustness analysis, it is possible to identify which variable is influencing a certain region of the product. An analysis illustrated in Figure 4 shows that material thickness is a determining factor in determining the quality and dimensions of the final product.

Fig. 4: Thinning sensitivity analysis of process parameters

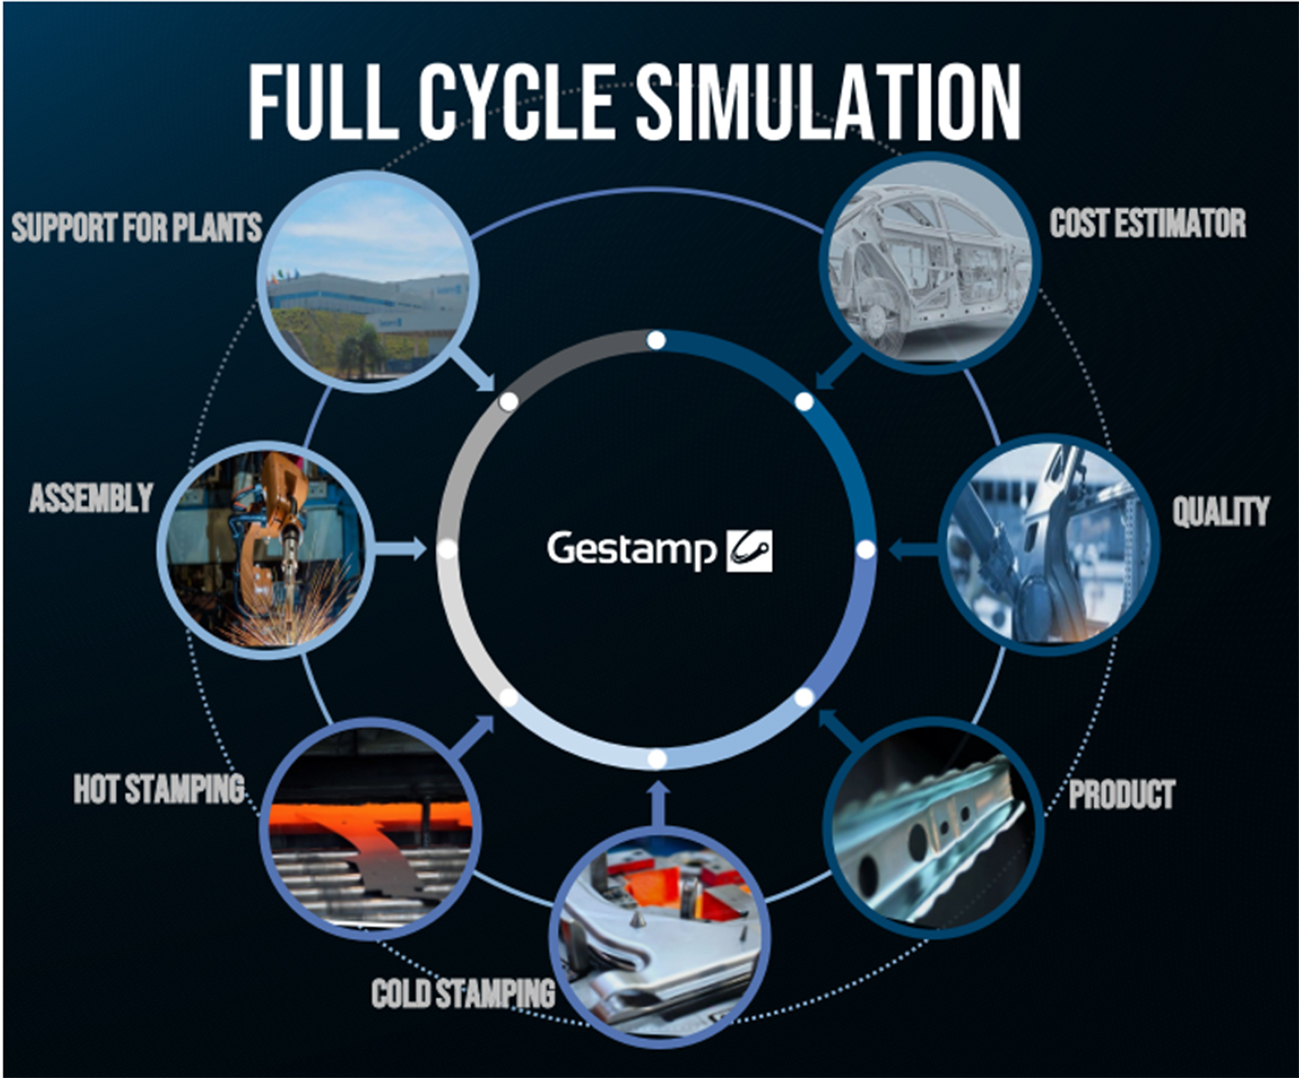
With significant reductions in reworks, quicker problem detection, and improved product quality, Gestamp has demonstrated the applications of advanced engineering, as shown in Figure 5. This encompasses everything from feasibility assessments and process plan definitions to tooling costs for single parts in cold forming, hot forming, assembly joining, and production support. 

Figure 5: Gestamp’s process cycle

The feasibility and assembly dimensions of this process are crucial to the smooth operation of the production line. By analyzing the assembly’s initial joining process, we can assess the overall layout, identify parts with greater influence, and suggest possible geometry changes to optimize efficiency and manufacturing quality. 

We explore comprehensive understanding of the Assembly and Hemming modules to evaluate assembly processes. This includes different hemming and spot welding systems and considers nominal, formed, and digitized parts. We also perform a dimensional evaluation of the final assembly, taking into account the combined springback effects of the different parts.

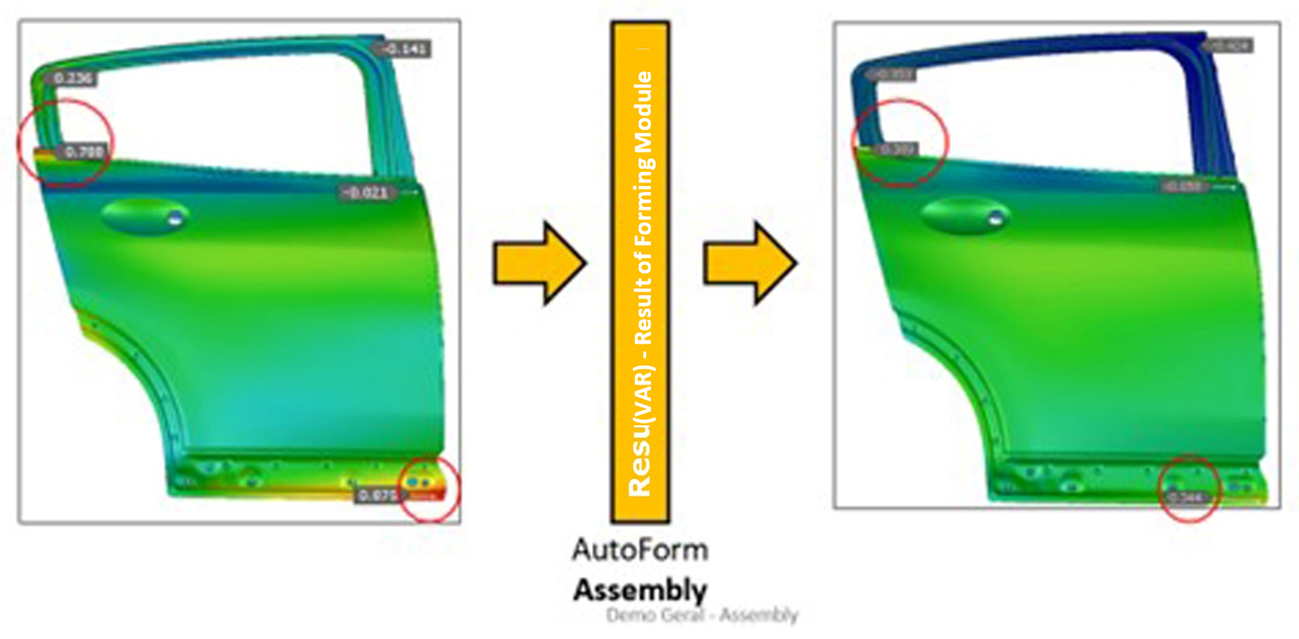
In process engineering, it is important to consider the effects of springback and, if necessary, adapt the joining processes. Identifying the necessary adjustments and defining try-out parameters are crucial steps to ensure satisfactory results. The assembly software features the VAR (Virtual Assembly Reference) concept to achieve this end—a powerful tool capable of performing geometric compensation of a single part based on the assembly results. Figure 6 illustrates the assembly comparison between the uncompensated products (on the left) and the result with compensation applied to the inner panel (on the right).

Figure 6: Compensation – Virtual Assembly Reference (VAR)

Try-out support involves addressing assembly issues related to the sequence of part insertion into the device or even the stability of single items. This process enables necessary changes to be applied as required. Meanwhile, production support focuses on solving emerging challenges, reducing downtime, and minimizing errors during production to improve process efficiency. The assembly module also enables existing assemblies to be analyzed, considering digitization for more precise analysis and definition of appropriate production parameters to ensure manufacturing excellence. Recognizing these details contributes significantly to the success of the project and customer satisfaction.

Gestamp was a pioneer in implementing assembly in Brazil. With the results obtained, it has been developing procedures and requirement specifications to advance and guarantee the stability of the parts in assembly, focusing on the quality and dimensional accuracy.

By identifying issues in the engineering phase, companies can avoid unnecessary waste from product development to final assembly and the layout of support points that influence dimensionality during the welding process. Once again, Gestamp has provided comprehensive and high-quality content, showcasing some process applications in development that have led to great satisfaction among the team.

From the Second BiW Development Engineering: “In simulations in assembly mode, we test and improve manufacturing processes at the conception stage, allowing us to deal with more realistic schedules that guarantee a significant reduction in delivery times and the creation of production shortcuts that help reduce errors. The advantages of this are improved productivity, quality, efficiency, cost savings, shorter development times, adjustments and, most importantly, innovation for Gestamp.”

We are very grateful to Leandro Pedracolli for his trust and initiative in promoting digital twins at Gestamp. Atair Cainan Figueiredo Bello Lopes played a key role in coordinating the presentations. We also extend our appreciation to Leonardo Fernandes Dompieri and Leonardo Freitas Oliveira for sharing their experiences and contributions with us during the webinars. We value the collaboration and participation of everyone involved.

Saying good-bye to Gary Conners

0
Saying good-bye to Gary Conners

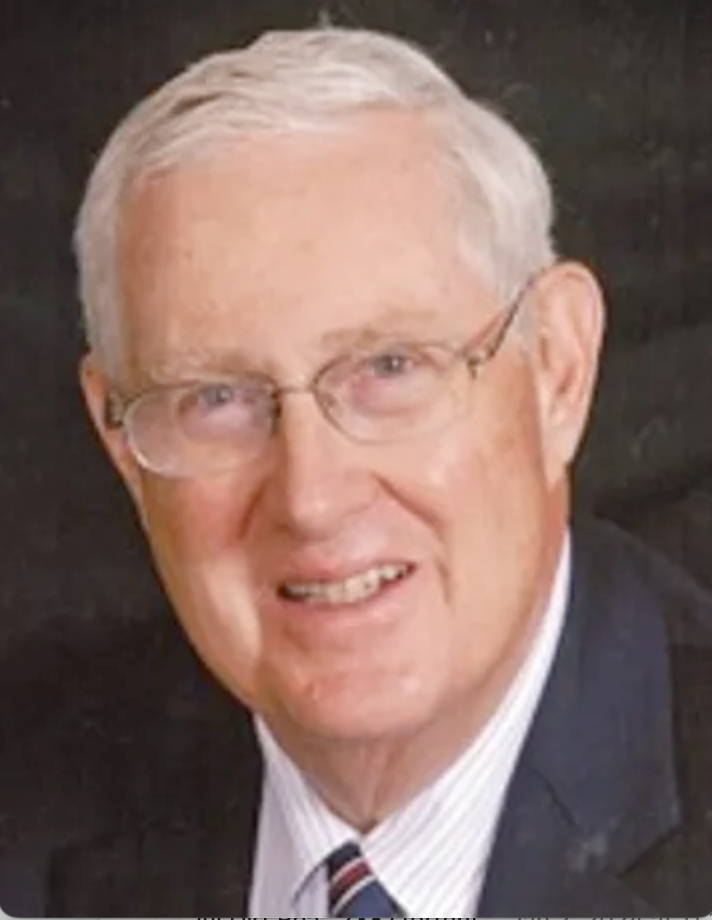
Gary was born on February 15, 1936, the son of Hamilton and Jessie Conners of East Rochester, NY. His father was Police Chief of the village of East Rochester at that time. His paternal grandparents, Thomas and Elizabeth Conners, as well as many other relatives lived in the village. He had one brother, Donald, who was 14 years older than himself.

Gary attended the East Rochester public schools and graduated as valedictorian of the ERHS class of 1953. He then attended St. Lawrence University as a Trustee Scholar, where he graduated in 1957 with a BS in Physics and a minor in Mathematics. Throughout his high school and college education he was active in numerous singing groups, including the St. Lawrence Madrigal Singers and Laurentian Singers. During his senior year, he was president of his college fraternity, Alpha Zeta chapter of Sigma Pi.

Saying good-bye to Gary ConnersFollowing his college graduation, Gary worked in the Research Laboratory of Delco Appliance Div. of General Motors, and in addition took graduate courses in mathematics at the University of Rochester (UR). In 1959 he was awarded a fellowship by General Motors to pursue a PhD program. Most important, in 1959 he and Gwenyth Caccamise of Rochester began their married life, a life filled with love and blessings of a large and wonderful family. They have 4 children, Gregory (Jan) of Syracuse, Mark (Karen) of Pittsford, Lisa of Bethesda, MD and Peter of Rochester. In addition, they have 11 grandchildren.

Following their wedding, Gary and Gwen moved to East Lansing, MI where Gary completed his PhD in Theoretical and Applied Mechanics. He divided his working career between industry and academia. In 1963 he became an Assistant Professor of Mechanical and Aerospace Science at the University of Rochester, where he taught and did research and consulting for the aerospace industry. In 1967 he joined Eastman Kodak as a research engineer, but continued part-time teaching at the University for 15 more years.

Gary had important consulting and management roles in the Center for Electronic Imaging Sciences (CEIS) at the University of Rochester.

It was the Air Force Office of Scientific Research (AFOSR) under the Joint Service Electronics Program (JSEP) that funded an early grant to principal investigators Moshe Lubin and Gary Conners for the laser work at the University of Rochester which ultimately led to the Laboratory for Laser Energetics.

Gary retired from Eastman Kodak in 1991 as Vice President of Eastman Kodak and General Manager of the Federal Systems Division, after many years as a leader in the business of designing and building space-based reconnaissance systems. While at Kodak he completed the Advanced Management Program at Harvard Business School. He later retired again as Associate Provost and Acting Dean of Engineering at RIT, after having served in several positions at UR and RIT including teaching many courses in Theoretical Mechanics and Applied Mathematics. He was also Associate Director of the Center for Electronic Imaging Systems at UR.

After his retirement, he served as a consultant for Boeing and other aerospace companies in the field of overhead reconnaissance systems. Along with 2 colleagues he also founded a small company called GGC Imaging; this company was later sold to Micron Inc. He also served on the Boards of several local organizations, including the Tennis Club of Rochester and the Rochester Area Bridge Association, and was for 4 years President of the Harvard Business School Club of Rochester.

Gary and Gwen enjoyed spending summers with their family at their home on Canandaigua Lake, beginning in 1990. They also enjoyed playing tennis and duplicate bridge, traveling on many cruises to all parts of the world, and sharing Christmas and other holidays with their family. In 2018 they became Life Masters in duplicate bridge. All of these things were done together, as partners, which was the way they lived their happy lives of 64 years together.

A Funeral Mass will be held Saturday, January 13, 10:30AM at Our Lady Queen of Peace, 601 Edgewood Ave, Rochester, NY 14618. Interment will be private. In lieu of flowers, contributions may be made to BOA Editions, 250 North Goodman Street, Suite 306, Rochester, NY 14607 or Pittsford Volunteer Ambulance c/o Fund Drive Chairperson, 40 Tobey Road, Pittsford, NY 14534. To share a memory of Gary or send a condolence to the family visit www.anthonychapels.com.

geophysics – How is the mass of the Earth determined?

0
geophysics – How is the mass of the Earth determined?

Note: I updated this answer to include a description of the historical techniques.

Historical Techniques

Newton developed his theory of gravitation primarily to explain the motions of the bodies that form the solar system. He also realized that while gravity makes the Earth orbit the Sun and the Moon orbit the Earth, it is also responsible for apples falling from trees. Everything attracts everything else, gravitationally. That suggested that one could in theory measure the gravitational attraction between a pair of small spheres. Newton himself realized this, but he didn’t think it was very practical. Certainly not two small spheres (Newton 1846):

Whence a sphere of one foot in diameter, and of a like nature to the
earth, would attract a small body placed near its surface with a force
20000000 times less than the earth would do if placed near its surface;
but so small a force could produce no sensible effect. If two such spheres
were distant but by 1 of an inch, they would not, even in spaces void of
resistance, come together by the force of their mutual attraction in less
than a month’s time; and less spheres will come together at a rate yet
slower, namely in the proportion of their diameters.

Maybe a mountain?

Nay, whole mountains will not be sufficient to produce any sensible effect. A mountain of an hemispherical figure, three miles high, and six broad, will not, by its attraction, draw the pendulum two minutes out of the true perpendicular :
and it is only in the great bodies of the planets that these forces are to be
perceived, …

Newton’s idea on the impracticality of such tiny measurements would turn out to be incorrect. Little did Newton know that the scientific revolution that he himself helped propel would quickly make such tiny measurements possible.

Weighing the Earth using mountains

The first attempt to “weigh the Earth” was made during the French geodesic mission to Peru by Pierre Bouguer, Charles Marie de La Condamine, and Louis Godin. Their primary mission was to determine the shape of the Earth. Did the Earth have an equatorial bulge, as predicted by Newton? (The French had sent a different team to Lapland to accomplish the same end.) Bouguer used the trip as an opportunity to test Newton’s suggestion that a mountain would deflect a plumb bob from surveyed normal. He chose Chimborazo as the subject mountain. Unfortunately, the measurements came up completely wrong. The plumb bob was deflected, but in the wrong direction. Bouguer measured a slight deflection away from the mountain (Beeson, webpage).

The next attempt was the Schiehallion experiment. While surveying the Mason-Dixon line, Charles Mason and Jeremiah Dixon found that occasionally their calibrations just couldn’t be made to agree with one another. The cause was that their plumb bobs occasionally deviated from surveyed normal. This discovery led to the Schiehallion experiment conducted by Nevil Maskelyne. Unlike Bouguer, Maskelyne did get a positive result, a deflection of 11.6 arc seconds, and in the right direction. The observed deflections led Maskelyne to conclude that the mean density of the Earth is 4.713 times that of water (von Zittel 1914).

It turns out that Newton’s idea of using a mountain is fundamentally flawed. Others tried to repeat these experiments using other mountains. Many measured a negative deflection, as did Bouguer. There’s a good reason for this. For the same reason that we only see a small part of an iceberg (the bulk is underwater), we only see a small part of a mountain. The bulk of the mountain is inside the Earth. A huge isolated mountain should make a plumb bob deviate away from the mountain.

Weighing the Earth using small masses

So if using mountains is dubious, what does that say about the dubiousness of using small masses that would take months to approach one another even if separated by mere inches?

This turned out to be a very good idea. Those small masses are controllable and their masses can be measured to a high degree of accuracy. There’s no need to wait until they collide. Simply measure the force they exert upon one another.

This idea was the basis for the Cavendish experiment (Cavendish 1798). Cavendish used two small and two large lead spheres. The two small spheres were hung from opposite ends of a horizontal wooden arm. The wooden arm in turn was suspended by a wire. The two large spheres were mounted on a separate device that he could turn to bring a large sphere very close to a small sphere. This close separation resulted in a gravitational force between the small and large spheres, which in turn caused the wire holding the wooden arm to twist. The torsion in the wire acted to counterbalance this gravitational force. Eventually the system settled to an equilibrium state. He measured the torsion by observing the angular deviation of the arm from its untwisted state. He calibrated this torsion by a different set of measurements. Finally, by weighing those lead spheres Cavendish was able to calculate the mean density of the Earth.

Note that Cavendish did not measure the universal gravitational constant G. There is no mention of a gravitational constant in Cavendish’s paper. The notion that Cavendish measured G is a bit of historical revisionism. The modern notation of Newton’s law of universal gravitation, $F=\frac {GMm}{r^2}$, simply did not exist in Cavendish’s time. It wasn’t until 75 years after Cavendish’s experiments that Newton’s law of universal gravitation was reformulated in terms of the gravitational constant G. Scientists of Newton’s and Cavendish’s times wrote in terms of proportionalities rather than using a constant of proportionality.

The very intent of Cavendish’s experiment was to “weigh” the Earth, and that is exactly what he did.

Modern Techniques

If the Earth was spherical, if there were no other perturbing effects such as gravitational acceleration toward the Moon and Sun, and if Newton’s theory of gravitation was correct, the period of a small satellite orbiting the Earth is given by Kepler’s third law: $\left( \frac T {2\pi} \right)^2 = \frac {a^3}{GM_E}$ . Here $T$ is the satellite’s period, $a$ is the satellite’s semi-major axis (orbital radius), $G$ is the universal gravitational constant, and $M_E$ is the mass of the Earth.

From this, it’s easy solve for the product $G M_E$ if the period $T$ and the orbital radius $a$ are known: $G M_E = \left( \frac {2\pi} T \right)^2 a^3$. To calculate the mass of the Earth, all one needs to do is divide by $G$. There’s a catch, though. If the product is $G M_E$ is known to a high degree of accuracy (and it is), dividing by $G$ will lose a lot of accuracy because the gravitational constant $G$ is only known to four decimal places of accuracy. This lack of knowledge of $G$ inherently plagues any precise measurement of the mass of the Earth.

I put a lot of caveats on this calculation:

  • The Earth isn’t spherical. The Earth is better modeled as an oblate spheroid. That equatorial bulge perturbs the orbits of satellites (as do deviations from the oblate spheroid model).
  • The Earth isn’t alone in the universe. Gravitation from the Moon and Sun (and the other planets) perturb the orbits of satellites. So does radiation from the Sun and from the Earth.
  • Newton’s theory of gravitation is only approximately correct. Einstein’s theory of general relativity provides a better model. Deviations between Newton’s and Einstein’s theories become observable given precise measurements over a long period of time.

These perturbations need to be taken into account, but the basic idea still stands: One can “weigh the Earth” by precisely observing a satellite for a long period of time. What’s needed is a satellite specially suited to that purpose. Here it is:

geophysics – How is the mass of the Earth determined?

This is LAGEOS-1, launched in 1976. An identical twin, LAGEOS-2, was deployed in 1992. These are extremely simple satellites. They have no sensors, no effectors, no communications equipment, no electronics. They are completely passive satellites. They are just solid brass balls 60 cm in diameter, covered with retroreflectors.

Instead, of having the satellite make measurements, people on the ground aim lasers at the satellites. That the satellites are covered with retroreflectors means some of the laser light that hits a satellite will be reflected back to the source. Precisely timing the delay between the emission and the reception of the reflected light gives a precise measure of the distance to the satellite. Precisely measuring the frequency change between the transmitted signal and the return signal gives a precise measure of the rate at which the distance is changing.

By accumulating these measurements over time, scientists can very precisely determine these satellites orbits, and from that they can “weigh the Earth”. The current estimate of the product $G M_E$ is $G M_E=398600.4418 \pm 0.0009 \ \text{km}^3/\text{s}^2$. (NIMA 2000). That tiny error means this is accurate to 8.6 decimal places. Almost all of the error in the mass of the Earth is going to come from the uncertainty in $G$.

References

M. Beeson, “Bouguer fails to weigh the Earth” (webpage)

H. Cavendish, “Experiments to determine the Density of the Earth,” Phil. Trans. R. Soc. London, 88 (1798) 469-526

I. Newton (translated by A. Motte), Principia, The System of the World (1846)

NIMA Technical Report TR8350.2, “Department of Defense World Geodetic System 1984, Its Definition and Relationships With Local Geodetic Systems”, Third Edition, January 2000

K. von Zittel (translated by M. Ogilvie-Gordon), “History of Geology and Palæontology to the End of the Nineteenth Century,” (1914)

2007 NASCAR Busch East Series: Difference between revisions

0
2007 NASCAR Busch East Series: Difference between revisions


Line 389: Line 389:

”’Did not Qualify”’: (8) Jonathan Cash (#59), [[Jonathan Smith (NASCAR Driver)|Jonathan Smith]] (#5), [[Pierre Bourque (web entrepreneur)|Pierre Bourque]] (#7), James Pritchard Jr. (#41), Jeremy Clark (#25), Tim Cowen (#75), Glenn Sullivan (#15), Blair Addis (#8)

”’Did not Qualify”’: (8) Jonathan Cash (#59), [[Jonathan Smith (NASCAR Driver)|Jonathan Smith]] (#5), [[Pierre Bourque (web entrepreneur)|Pierre Bourque]] (#7), James Pritchard Jr. (#41), Jeremy Clark (#25), Tim Cowen (#75), Glenn Sullivan (#15), Blair Addis (#8)

”’Notes:”’ ”Logano’s win in his first start in the series made him the first driver to repeat this feat since Kip Stockwell got his only win in his first start in the series at [[Thunder Road International SpeedBowl]] in 1997.

”’Notes:”’ ”Logano’s win in his first start in the series made him the first driver to repeat this feat since Kip Stockwell got his only win in his first start in the series at [[Thunder Road International SpeedBowl]] in 1997.

=== Minnesota 150 ===

=== Minnesota 150 ===

NASCAR season

2007 NASCAR Busch East Series: Difference between revisions
Joey Logano, the 2007 Busch East Series champion.
Sean Caisse, driving the No. 44 car for Andy Santerre, finished second behind Logano in the championship by 166 points.
Peyton Sellers finished third in the championship.

The 2007 NASCAR Busch East Series was the 21st season of the Busch East Series, a stock car racing series sanctioned by NASCAR. The season consisted of thirteen races and began on April 28 at Greenville-Pickens Speedway with the Greased Lightning 150. The season finale, the Sunoco 150, was held on September 21 at Dover International Speedway. Mike Olsen entered the season as the defending drivers’ champion. Joey Logano won the championship, 166 points in front of Sean Caisse.

This season was the last season with Anheuser-Busch’s Busch Beer as the series’ title sponsor after a 21-year relationship. Busch was replaced by Camping World as the title sponsor for 2008.

By virtue of NASCAR’s lower age limit of 16 starting this year for its touring series, Logano became the youngest champion of the series at that time. He started the season when he was just 16 years old, and turned 17 during the season on May 24. The lowering of the age limit in 2007 was instrumental in the future of the series, as most of the drivers who compete in the East Series now are teenagers. The age limit would eventually be lowered again to 15, which is what it is today.

* Races will air on delay only. All HDNet races will air live and re-air on SPEED.

Both HDNet and SPEED returned to broadcast most of the races. HDNet broadcast nine of the races, including the final seven, live in high definition. Speed aired three of the remaining four races by a broadcast delay. All of the races shown on HDNet were also re-broadcast in standard definition on Speed.

Greased Lightning 150

[edit]

The Greased Lightning 150 was run on April 28 at Greenville-Pickens Speedway in Greenville, SC. Joey Logano sat on the pole for the event and went on to win the event. This marked Logano’s first pole and first win in the series in his first start.

Official Results
Finish Start Car # Driver Hometown Car Laps Reason Out
1 1 20 Joey Logano Middletown, Conn. Chevrolet 150
2 2 44 Sean Caisse Pelham, N.H. Chevrolet 150
3 3 99 Bryon Chew Mattituck, N.Y. Chevrolet 150
4 5 83 Peyton Sellers Danville, Va. Chevrolet 150
5 11 03 Rogelio López Mexico City, Mexico Chevrolet 150
6 8 1 Jeffrey Earnhardt Mooresville, N.C. Chevrolet 150
7 16 61 Mike Olsen N. Haverhill, N.H. Chevrolet 150
8 21 37 Michelle Theriault Bristol, Conn. Chevrolet 150
9 7 57 John S. Freeman Huntersville, N.C. Chevrolet 150
10 20 3 John Wes Townley Watkinsville, Ga. Chevrolet 150
11 26 4 Jesus Hernandez Fresno, Calif. Chevrolet 150
12 12 18 Marc Davis Mitchelville, Md. Chevrolet 150
13 17 52 Jamie Hayes Norlina, N.C. Chevrolet 150
14 25 63 John Salemi Nashua, N.H. Chevrolet 150
15 6 35 Eric Holmes Salida, Calif. Chevrolet 150
16 29 26 Scott Bouley Wolcott, Conn. Chevrolet 150
17 13 43 Tim Schendel Sparta, Wis. Dodge 150
18 28 30 Jeff Anton Russell, Mass. Chevrolet 150
19 19 66 Chase Austin Eudora, Kan. Dodge 150
20 15 58 Richard Gould N. Brunswick, N.J. Chevrolet 150
21 4 40 Matt Kobyluck Uncasville, Conn. Chevrolet 148
22 22 84 Dion Ciccarelli Severn, Md. Chevrolet 147
23 9 91 Richard Jarvis Jr. Ocean Pines, Md. Chevrolet 146
24 18 96 Mike Johnson Salisbury, Mass. Ford 144
25 27 2 Max Dumarey Gent, Belgium Dodge 144
26 14 21 Germán Quiroga Mexico City, Mexico Chevrolet 128 Accident
27 24 50 Todd Peck Glendale, Penn. Chevrolet 124 Accident
28 23 23 Casey Wyatt Newport News, Va. Chevrolet 114 Accident
29 30 24 Patrick Dupree Saranac Lake, N.Y. Dodge 114 Accident
30 10 22 Rubén Pardo Mexico City, Mexico Dodge 114 Accident
Fastest Qualifier: Joey Logano, 87.481 mph (140.787 km/h), 20.576 seconds
Time of Race: 1 hour 27 minutes 37 seconds
Margin of Victory: 4.595 seconds
Lead changes: 3 among 2 drivers
Cautions: 4 for 62 laps
Lap Leaders: S.Caisse 1-74; J.Logano 75-121; Caisse 122-122; Logano, 123-150

Did not Qualify: (8) Jonathan Cash (#59), Jonathan Smith (#5), Pierre Bourque (#7), James Pritchard Jr. (#41), Jeremy Clark (#25), Tim Cowen (#75), Glenn Sullivan (#15), Blair Addis (#8)

Notes: Logano’s win in his first start in the series made him the first driver to repeat this feat since Kip Stockwell got his only win in his first start in the series at Thunder Road International SpeedBowl in 1997.

The Minnesota 150 took place on May 18 at Elko Speedway in Elko, Minnesota. This race marked the first time that the East and West series would meet during the regular season for a points race. Sean Caisse took the pole and went on to win the race. Only he and fellow East series competitor Mike Olsen would lead the race.

Official Results
Finish Start Car # Series Driver Hometown Car Laps Reason Out
1 1 44 E Sean Caisse Pelham, N.H. Chevrolet 156
2 23 99 E Bryon Chew Mattituck, N.Y. Chevrolet 156
3 18 2 W Mike David Modesto, Calif. Ford 156
4 12 03 E Rogelio López Mexico City, Mexico Chevrolet 156
5 5 61 E Mike Olsen N. Haverhill, N.H. Chevrolet 156
6 11 83 E Peyton Sellers Danville, Va. Chevrolet 156
7 10 4 E Jesus Hernandez Fresno, Calif. Chevrolet 156
8 16 66 W Justin Lofton Westmorland, Calif. Ford 156
9 30 5 W Eric Hardin Anaheim, Calif. Chevrolet 156
10 19 37 E Michelle Theriault Bristol, Conn. Chevrolet 156
11 9 52 E Jamie Hayes Norlina, N.C. Chevrolet 156
12 17 40 E Matt Kobyluck Uncasville, Conn. Chevrolet 156
13 14 35 E Eric Holmes Salida, Calif. Chevrolet 156
14 29 30 E Jeff Anton Russell, Mass. Chevrolet 156
15 24 9 W Mike Duncan Bakersfield, Calif. Chevrolet 156
16 15 22 W Jason Bowles Ontario, Calif. Ford 156
17 7 43 E Tim Schendel Sparta, Wis. Dodge 156
18 26 54 W Tim Woods III Chino Hills, Calif. Ford 156
19 2 16 W Brian Ickler San Diego, Calif. Chevrolet 156
20 4 10 E Joey Logano Middletown, Conn. Chevrolet 156
21 27 32 E Rubén Pardo Mexico City, Mexico Dodge 155
22 25 51 E Jonathan Smith Beacon Falls, Conn. Chevrolet 155
23 28 8 W Johnny Borneman III Ramona, Calif. Ford 154
24 3 11 E Jeffrey Earnhardt Mooresville, N.C. Chevrolet 145 Accident
25 8 92 E Marc Davis Mitchelville, Md. Chevrolet 144
26 22 88 W Alex Haase Las Vegas, Nev. Chevrolet 108
27 20 81 W Brett Thompson Jerome, Idaho Chevrolet 67 Clutch
28 13 18 W Moses Smith Tempe, Ariz. Chevrolet 50 Accident
29 21 14 W Andrew Myers Newport Beach, Calif. Chevrolet 50 Accident
30 6 91 E Richard Jarvis Jr. Ocean Pines, Md. Chevrolet 37 Engine
Fastest Qualifier: Sean Caisse, 95.440 mph (153.596 km/h), 14.145 Seconds
Time of Race: 1 hour 11 minutes 26 seconds
Margin of Victory: .305 seconds
Lead changes: 4 among 2 drivers
Cautions: 9 for 72 laps
Lap Leaders: S.Caisse 1-28; M.Olsen 29-41; S.Caisse 42-72; M.Olsen 73-103; S.Caisse 104-156

Did not Qualify: (16) Ryan Foster (#21W), John Salemi (#63E), Stan Silva Jr. (#65W), Eric Richardson (#20W), Jim Inglebright (#1W), Scott Bouley (#26E), Chase Austin (#64E), Dion Ciccarelli (#84E), Germán Quiroga (#12E), Lloyd Mack (#09W), Jack Sellers (#15W), Blair Addis (#3E), Daryl Harr (#71W), Jerick Johnson (76E), Mike Gallegos (#77W), Pierre Bourque (#7E)

Note: Both series would meet again 2 days later for the second and final combination race at Iowa Speedway

Featherlite Coaches 200

[edit]

The Featherlite Coaches 200 was run on May 5 at the Iowa Speedway in Newton, Iowa. This race, sponsored by Featherlite Coaches, was the second and final meeting between the East and West series during the regular season. Kevin Harvick was on hand to take part in the race. Harvick would narrowly take the pole over Joey Logano. These two drivers would proceed to swap the lead 15 times between the two of them. In the end, it would be Logano taking the win over the Nextel Cup star.

Official Results
Finish Start Car # Series Driver Hometown Car Laps Reason Out
1 2 10 E Joey Logano Middletown, Conn. Chevrolet 200
2 1 33 W Kevin Harvick Bakersfield, Calif. Chevrolet 200
3 23 4 E Jesus Hernandez Fresno, Calif. Chevrolet 200
4 37 8 W Johnny Borneman III Ramona, Calif. Ford 200
5 3 9 W Mike Duncan Bakersfield, Calif. Chevrolet 200
6 17 66 W Justin Lofton Westmorland, Calif. Ford 200
7 12 81 W Brett Thompson Jerome, Idaho Chevrolet 200
8 7 30 E Jeff Anton Russell, Mass. Chevrolet 200
9 18 20 W Eric Richardson Bakersfield, Calif. Chevrolet 200
10 31 31 W Tim McCreadie Watertown, N.Y. Chevrolet 200
11 33 21 W Ryan Foster Anderson, Calif. Chevrolet 200
12 11 63 E John Salemi Nashua, N.H. Chevrolet 200
13 19 6 W David Mayhew Atascadero, Calif. Chevrolet 200
14 27 51 E Jonathan Smith Beacon Falls, Conn. Chevrolet 200
15 39 5 W Eric Hardin Anaheim, Calif. Chevrolet 200
16 36 03 E Rogelio López Mexico City, Mexico Chevrolet 200
17 34 71 W Daryl Harr St. Albert, AB Chevrolet 200
18 32 11 E Jeffrey Earnhardt Mooresville, N.C. Chevrolet 200
19 8 16 W Brian Ickler San Diego, Calif. Chevrolet 200
20 24 2 W Mike David Modesto, Calif. Ford 199
21 42 57 E John Freeman Huntersville, N.C. Chevrolet 199
22 35 22 W Jason Bowles Ontario, Calif. Ford 199
23 28 1 W Jim Inglebright Fairfield, Calif. Chevrolet 198
24 40 84 E Dion Ciccarelli Severn, Md. Chevrolet 198
25 9 14 W Andrew Myers Newport Beach, Calif. Chevrolet 197
26 20 37 E Michelle Theriault Bristol, Conn. Chevrolet 197
27 41 88 W Alex Haase Las Vegas, Nev. Chevrolet 197
28 10 52 E Jamie Hayes Norlina, N.C. Chevrolet 196
29 29 61 E Mike Olsen N. Haverhill, N.H. Chevrolet 192
30 13 32 E Rubén Pardo Mexico City, Mexico Dodge 175
31 22 29 W Scott Lynch Burley, Idaho Dodge 175 Accident
32 25 7 E Pierre Bourque Ottawa, Ont. Dodge 171 Accident
33 14 46 W Jeff Barkshire Auburn, Wash. Chevrolet 166
34 5 92 E Marc Davis Mitchelville, Md. Chevrolet 165 Vibration
35 26 91 E Richard Jarvis Jr. Ocean City, Md. Chevrolet 150 Vibration
36 21 40 E Matt Kobyluck Uncasville, Conn. Chevrolet 113 Accident
37 6 44 E Sean Caisse Pelham, N.H. Chevrolet 94 Accident
38 16 35 E Eric Holmes Salida, Calif. Chevrolet 76 Engine
39 38 99 E Bryon Chew Mattituck, N.Y. Chevrolet 51 Clutch
40 4 83 E Peyton Sellers Danville, Va. Chevrolet 51 Engine
41 30 43 E Tim Schendel Sparta, Wis. Dodge 9 Accident
42 15 3 E John Wes Townley Watkinsville, Ga. Chevrolet 3 Accident
Fastest Qualifier: Kevin Harvick, 133.775 mph (215.290 km/h), 23.547 seconds
Time of Race: 2 hours 10 minutes 8 seconds
Margin of Victory: 2.400 seconds
Lead changes: 18 among 4 drivers
Cautions: 10 for 68 laps
Lap Leaders: Harvick 1-38; Logano 39-41; Harvick 42-44; Logano 45-60; Harvick 61-85; Logano 86; Harvick 87-89; Logano 90; Harvick 91; Logano 92-101; Lofton 102-103; Duncan 104-130; Lofton 131-135; Harvick 136-162; Logano 163; Harvick 164-165; Logano 166-184; Harvick 185-193; Logano 194-200

Did not Qualify: (10) Chase Austin (68 E), Mike Gallegos (77 W), Stan Silva Jr. (65 W), Chris Bristol (12 E), Kyle Cattanach (59 W), Jerick Johnson (76 E), Scott Bouley (26 E), Tim Woods III (54 W), Jack Sellers (15 W), Trevor Bayne (00 E)

The South Boston 150 was run on June 2 at the South Boston Speedway in South Boston, Virginia. Peyton Sellers, who was the track’s Late Model champion in 2005 en route to winning the NASCAR Whelen All-American Series title and also has a grandstand at the track named after him took the pole in qualifying. The race turned into a two-man race between Sellers and Matt Kobyluck swapping the lead for eleven of the twelve lead changes. Sellers lead a race high of 101 laps while Kobyluck lead 46. Sean Caisse would be the only other driver to lead during the race when he managed to jump into the lead for the first three laps. With restarts coming with 10 laps to go and again at 4 to go, Kobyluck was able to maintain the lead and go on to win his first race of the season.

Official Results
Finish Start Car # Driver Hometown Car Laps Reason Out
1 4 40 Matt Kobyluck Uncasville, Conn. Chevrolet 150
2 1 83 Peyton Sellers Danville, Va. Chevrolet 150
3 3 20 Joey Logano Middletown, Conn. Chevrolet 150
4 5 92 Marc Davis Mitchelville, Md. Chevrolet 150
5 6 03 Rogelio López Mexico City, Mexico Chevrolet 150
6 14 52 Jamie Hayes Norlina, N.C. Chevrolet 150
7 8 61 Mike Olsen N. Haverhill, N.H. Chevrolet 150
8 20 35 Eric Holmes Salida, Calif. Ford 150
9 18 43 Tim Schendel Sparta, Wis. Dodge 150
10 16 66 Chase Austin Eudora, Kan. Dodge 150
11 10 91 Richard Jarvis Jr. Ocean City, Md. Chevrolet 150
12 19 30 Jeff Anton Russell, Mass. Chevrolet 150
13 11 99 Bryon Chew Mattituck, N.Y. Chevrolet 150
14 15 42 Landon Cassill Charlotte, N.C. Chevrolet 150
15 9 58 Ben Stancill Ayden, N.C. Chevrolet 150
16 25 22 Rubén Pardo Mexico City, Mexico Dodge 150
17 12 84 Dion Ciccarelli Severn, Md. Chevrolet 150
18 17 5 Jonathan Smith Beacon Falls, Conn. Chevrolet 150
19 32 25 Jeremy Clark Concord, N.C. Chevrolet 150
20 21 1 Jeffrey Earnhardt Mooresville, N.C. Chevrolet 150
21 23 63 John Salemi Nashua, N.H. Chevrolet 149
22 30 50 Todd Peck Glenville, Pa. Chevrolet 148
23 27 28 A. J. Lane Carleton, Mich. Ford 147
24 26 26 Scott Bouley Wolcott, Conn. Chevrolet 147
25 22 16 Max Dumarey Gent, Belgium Chevrolet 147
26 28 21 Chris Bristol Columbus, Ohio Chevrolet 146
27 2 44 Sean Caisse Pelham, N.H. Chevrolet 144
28 31 41 James Pritchard Jr. Wharton, N.J. Chevrolet 139
29 24 59 Jonathan Cash Oxford, N.C. Ford 139
30 29 3 Blair Addis Greenville, S.C. Chevrolet 137
31 7 4 Jesus Hernandez Fresno, Calif. Chevrolet 133
32 13 37 Michelle Theriault Bristol, Conn. Chevrolet 117
Fastest Qualifier: Peyton Sellers, 92.414 mph (148.726 km/h), 15.582 seconds
Time of Race: 1 hour 13 minutes 15 seconds
Margin of Victory: 0.411 seconds
Lead changes: 12 among 3 drivers
Cautions: 8 for 52 laps
Lap Leaders: Caisse 1-3; Sellers 4-20; Kobyluck 21-30; Sellers 31-66; Kobyluck 67; Sellers 68-82; Kobyluck 83-99; Sellers 100-102; Kobyluck 103; Sellers 104; Kobyluck 105-110; Sellers 111-139; Kobyluck 140-150

Did not Qualify: None

TSI Harley-Davidson 150

[edit]

The TSI Harley-Davidson 150 took place on June 6 at Stafford Motor Speedway in Stafford, Connecticut. Sean Caisse would sit on the pole for the first time this season, but it would be Eddie MacDonald, who was making his first start of the season that would go on to take the win in grand fashion by leading the final 81 laps.

Official Results
Finish Start Car # Driver Hometown Car Laps Reason Out
1 5 48 Eddie MacDonald Rowley, Mass. Chevrolet 150
2 8 61 Mike Olsen N. Haverhill, N.H. Chevrolet 150
3 2 40 Matt Kobyluck Uncasville, Conn. Chevrolet 150
4 9 18 Marc Davis Mitchelville, Md. Chevrolet 150
5 4 99 Bryon Chew Mattituck, N.Y. Chevrolet 150
6 13 4 Jesus Hernandez Fresno, Calif. Chevrolet 150
7 11 96 Mike Johnson Salisbury, Mass. Ford 150
8 10 66 Chase Austin Eudora, Kan. Dodge 150
9 22 63 John Salemi Nashua, N.H. Chevrolet 150
10 15 2 John Freeman Charlotte, N.C. Dodge 150
11 6 20 Joey Logano Middletown, Conn. Chevrolet 150
12 20 1 Jeffrey Earnhardt Mooresville, N.C. Chevrolet 150
13 25 26 Scott Bouley Wolcott, Conn. Chevrolet 150
14 3 83 Peyton Sellers Danville, Va. Chevrolet 150
15 16 22 Rubén Pardo Mexico City, Mexico Dodge 150
16 12 52 Jamie Hayes Norlina, N.C. Chevrolet 149
17 27 03 Rogelio López Mexico City, Mexico Ford 149
18 18 30 Jeff Anton Russell, Mass. Chevrolet 149
19 7 35 Eric Holmes Salida, Calif. Ford 149
20 24 84 Dion Ciccarelli Severn, Md. Chevrolet 149
21 26 16 Max Dumarey Gent, Belgium Chevrolet 148
22 19 5 Jonathan Smith Beacon Falls, Conn. Chevrolet 146
23 14 91 Richard Jarvis Jr. Ocean City, Md. Chevrolet 132 Fuel Pump
24 1 44 Sean Caisse Pelham, N.H. Chevrolet 132
25 17 37 Michelle Theriault Bristol, Conn. Chevrolet 115
26 21 43 Tim Schendel Sparta, Wis. Dodge 109 Brakes
27 29 15 Glenn Sullivan Westbury, N.Y. Chevrolet 90 Brakes
28 23 21 Germán Quiroga Mexico City, Mexico Chevrolet 78 Rear End
29 28 41 James Pritchard Jr. Wharton, N.J. Chevrolet 71
30 30 85 Rob Humphreys Elbridge, N.Y. Chevrolet 53 Overheating
Fastest Qualifier: Sean Caisse, 91.963 mph (148.000 km/h), 19.573 seconds
Time of Race: 1 hour 12 minutes 36 seconds
Margin of Victory: 1.236 seconds
Lead changes: 4 among 4 drivers
Cautions: 5 for 31 laps
Lap Leaders: S.Caisse 1-30; M.Kobyluck 31-37; P.Sellers 38; M.Kobyluck 39-69; E.MacDonald 70-150

Did not Qualify: None

The New England 125 took place on June 6 at New Hampshire International Speedway in Loudon, New Hampshire. Joey Logano took the pole and went on to lead the most laps en route to his third win of the series. Series veteran Brad Leighton was in contention until he was deemed to have jumped the final restart leading to a green-white-checkered finish and subsequently was black flagged. Rather than risk disqualification, Leighton gave the lead back to Logano and would have to settle for a second-place finish.

Official Results
Finish Start Car # Driver Hometown Car Laps Reason Out
1 1 20 Joey Logano Middletown, Conn. Chevrolet 126
2 11 55 Brad Leighton Center Harbor, N.H. Chevrolet 126
3 26 43 Tim Schendel Sparta, Wis. Dodge 126
4 6 42 Landon Cassill Charlotte, N.C. Chevrolet 126
5 14 45 Brian Hoar Williston, Vt. Dodge 126
6 13 40 Matt Kobyluck Uncasville, Conn. Chevrolet 126
7 24 31 James Buescher Plano, Texas Chevrolet 126
8 18 22 Rubén Pardo Mexico City, Mexico Dodge 126
9 4 83 Peyton Sellers Danville, Va. Chevrolet 126
10 25 52 Jamie Hayes Norlina, N.C. Chevrolet 126
11 16 61 Mike Olsen N. Haverhill, N.H. Chevrolet 126
12 3 2 Josh Wise Riverside, Calif. Dodge 126
13 23 37 Michelle Theriault Bristol, Conn. Chevrolet 126
14 22 30 Jeff Anton Russell, Mass. Chevrolet 126
15 42 1 Jeffrey Earnhardt Mooresville, N.C. Chevrolet 126
16 29 14 Joe Masessa Franklin Lakes, N.J. Chevrolet 126
17 27 88 Mike Gallo Saco, Maine Ford 126
18 30 63 John Salemi Nashua, N.H. Chevrolet 126
19 34 26 Scott Bouley Wolcott, Conn. Chevrolet 126
20 8 57 John Freeman Charlotte, N.C. Chevrolet 126
21 35 41 James Pritchard Jr. Wharton, N.J. Chevrolet 126
22 41 84 Dion Ciccarelli Severn, Md. Chevrolet 126
23 19 4 Jesus Hernandez Fresno, Calif. Chevrolet 126
24 2 44 Sean Caisse Pelham, N.H. Chevrolet 126
25 39 24 Patrick Dupree Saranac Lake, N.Y. Dodge 125
26 38 96 Mike Johnson Salisbury, Mass. Ford 123
27 28 16 Max Dumarey Gent, Belgium Chevrolet 121
28 10 18 Marc Davis Mitchelville, Md. Chevrolet 120 Accident
29 17 47 Kelly Moore Scarborough, Maine Chevrolet 120 Accident
30 36 50 Todd Peck Glenville, Penn. Chevrolet 118 Accident
31 37 13 Garrett Liberty Jonesboro, Ga. Chevrolet 110 Accident
32 15 66 Chase Austin Eudora, Kan. Dodge 104 Accident
33 32 21 Germán Quiroga Mexico City, Mexico Chevrolet 103 Accident
34 33 5 Jonathan Smith Beacon Falls, Conn. Chevrolet 94 Accident
35 21 06 Ryan Seaman Toms River, N.J. Chevrolet 68 Accident
36 12 33 Tim McCreadie Watertown, N.Y. Chevrolet 68 Accident
37 40 25 Jeremy Clark Concord, N.C. Chevrolet 66 Radiator
38 20 35 Eric Holmes Salida, Calif. Chevrolet 56 Accident
39 31 15 Glenn Sullivan Westbury, N.Y. Chevrolet 51 Suspension
40 9 99 Bryon Chew Mattituck, N.Y. Chevrolet 31 Engine
41 7 48 Eddie MacDonald Rowley, Mass. Chevrolet 28 Suspension
42 43 28 A. J. Lane Carleton, Mich. Ford 24 Handling
43 5 03 Rogelio López Mexico City, Mexico Chevrolet 15 Fire
Fastest Qualifier: Joey Logano, 125.294 mph (201.641 km/h), 30.399 seconds
2 hours 0 minutes 55 seconds
Margin of Victory: 0.430 seconds
Lead changes: Logano 61, Leighton 48, Holmes 7, Buescher 6, Sellers 4.

9 changes among 4 drivers

Cautions: 10 for 64 laps
Lap Leaders: S.Caisse 1-30; M.Kobyluck 31-37; P.Sellers 38; M.Kobyluck 39-69; E.MacDonald 70-150

Did not Qualify: None

The Pepsi Racing 100 was run on July 14, at Thompson International Speedway in Thompson, CT. Sean Caisse would sit on the pole and nearly lead flag to flag in the race that was extended to 108 laps due to late race cautions that required two green-white-checkered attempts to end the race. Caisse only relinquished the lead for two laps en route to his second win of the season, breaking a four race streak of bad luck.

Official Results
Finish Start Car # Driver Hometown Car Laps Reason Out
1 1 44 Sean Caisse Pelham, N.H. Chevrolet 108
2 12 40 Matt Kobyluck Uncasville, Conn. Chevrolet 108
3 7 61 Mike Olsen N. Haverhill, N.H. Chevrolet 108
4 13 55 Brad Leighton Center Harbor, N.H. Chevrolet 108
5 4 20 Joey Logano # Middletown, Conn. Chevrolet 108
6 8 31 James Buescher Plano, Texas Chevrolet 108
7 9 22 Rubén Pardo Mexico City, Mexico Dodge 108
8 15 99 Bryon Chew Mattituck, N.Y. Chevrolet 108
9 11 35 Eric Holmes Salida, Calif. Ford 108
10 20 30 Jeff Anton Russell, Mass. Chevrolet 108
11 19 63 John Salemi Nashua, N.H. Chevrolet 108
12 5 83 Peyton Sellers Danville, Va. Chevrolet 108
13 30 39 Dustin Delaney Mayfield, Conn. Chevrolet 108
14 10 1 Jeffrey Earnhardt # Mooresville, N.C. Chevrolet 108
15 25 11 Laine Chase Beverly, Mass. Chevrolet 108
16 3 71 Eddie MacDonald Rowley, Mass. Chevrolet 108
17 23 16 Max Dumarey Gent, Belgium Chevrolet 108
18 6 4 Jesus Hernandez # Fresno, Calif. Chevrolet 108
19 18 84 Dion Ciccarelli Severn, Md. Chevrolet 107
20 28 21 Chris Bristol Columbus, Ohio Chevrolet 107
21 21 5 Jonathan Smith # Beacon Falls, Conn. Chevrolet 107
22 22 96 Mike Johnson Salisbury, Mass. Ford 107
23 16 37 Michelle Theriault # Bristol, Conn. Chevrolet 106
24 29 15 Glenn Sullivan Westbury, N.Y. Chevrolet 100
25 14 66 Chase Austin Emporia, Kan. Dodge 99
26 17 03 Rogelio López Aquascalientes, Mexico Chevrolet 91
27 24 52 Jamie Hayes Norlina, N.C. Chevrolet 40 Overheating
28 2 18 Marc Davis Mitchelville, Md. Chevrolet 33 Accident
29 26 41 James Pritchard Jr. Wharton, N.J. Chevrolet 25 Accident
30 27 26 Scott Bouley Wolcott, Conn. Chevrolet 25 Rear End
Fastest Qualifier: Sean Caisse, 109.508 mph (176.236 km/h), 20.382 seconds
Time of Race: 1 hour 2 minutes 43 seconds
Margin of Victory: .328 seconds
Laps Lead: S. Caisse 106; M. Davis 1; M. Kobyluck 1.
Lead changes: 3 changes involving 3 drivers
Cautions: 9 for 47 laps
Lap Leaders: M.Davis 1; S.Caisse 2-91; M.Kobyluck 92; S.Caisse 93-108.

Did not Qualify: (1) Rob Humphreys (#85)

– Coming Soon

Race won by Joey Logano after the last lap, last turn pass for the lead over Bryon (Buzz) Chew. Chew would be Disqualified resulting in Sean Caisse taking second position.

1 -Joey Logano,
2 -Sean Caisse,
3 -Marc Davis,
4 -Peyton Sellers,
5 -Eddie MacDonald,
6 -Dion Ciccarelli,
7 -Chase Austin,
8 -Jerry Marquis,
9 -James Pritchard, Jr.,
10 -Matt Kobyluck,
11 -Jeremy Clark,
12 -John Salemi,
13 -Rogelio Lopez,
14 -Jamie Hayes,
15 -Jeff Anton,
16 -Max Dumarey,
17 -Rob Humphreys,
18 -Dustin Delaney,
19 -Michelle Theriault,
20 -Scott Bouley,
21 -Jeffrey Oakley,
22 -Mike Olsen,
23 -Chris Bristol,
24 -Jeffrey Earnhardt,
25 -Jonathan Smith,
26(DQ)-Bryon Chew.

The 2007 The Edge Hotel 150 was a Busch East Series (now K & N Pro Series East) event held at Adirondack International Speedway on July 28, 2007. Joey Logano pulled out an impossible victory, making a last lap squeeze pass between leader Bryon Chew and the spinning car of Rogelio Lopez to pull out his fourth victory of the year, leading just the last quarter lap. Logano continued to pull far far away in the points, now 192 makers ahead of Matt Kobyluck.

Mohegan Sun NASCAR Busch East 200

[edit]

– Coming Soon

– Coming Soon

Aubuchon Hardware 125 presented by hardwarestore.com

[edit]

– Coming Soon

– Coming Soon

There are the final points standings for the 2007 season.

Official Results
Pos Car # Driver Total Att Starts Poles Wins Top5s Top10s DNFs
1 20 Joey Logano 2123 13 13 2 5 10 10
2 44 Sean Caisse 1957 13 13 5 4 8 8 1
3 83 Peyton Sellers 1862 13 13 1 4 9 1
4 40 Matt Kobyluck 1840 13 13 1 2 5 7 3
5 1 Jeffrey Earnhardt 1736 13 13 1 4 5 2
6 61 Mike Olsen 1721 13 13 3 6 2
7 03 Rogelio López 1671 13 13 1 1 5 5 1
8 52 Jamie Hayes 1661 13 13 1 5 2
9 18 Marc Davis 1654 13 13 4 6 4
10 30 Jeff Anton 1630 13 13 1 4
11 99 Bryon Chew 1603 13 13 4 6 3
12 4 Jesus Hernandez 1495 12 12 3 5 1
13 37 Michelle Theriault 1434 13 13 2 1
14 63 John Salemi 1416 13 12 1 2
15 66 Chase Austin 1322 13 11 4 1
16 5 Jonathan Smith 1286 13 12 4
17 22 Rubén Pardo 1278 11 11 3 2
18 84 Dion Ciccarelli 1262 13 12 1 3
19 16 Max Dumarey 1134 11 11 2 1
20 26 Scott Bouley 1066 13 11 1
21 48 Eddie MacDonald 988 8 8 1 2 3 1
22 43 Tim Schendel 847 7 7 1 2 2
23 35 Jerry Marquis 847 6 6 3
24 2 John Freeman 843 7 7 2 1
25 35 Eric Holmes 798 7 7 1 3 2
26 41 James Pritchard Jr. 789 10 9 1 2
27 96 Mike Johnson 655 6 6 1
28 31 James Buescher 569 4 4 4
29 91 Richard Jarvis Jr. 542 5 5 3
30 55 Brad Leighton 481 3 3 2 3
31 21 Germán Quiroga 408 6 5 5
32 50 Todd Peck 392 5 5 3
33 58 Richard Gould 367 3 3 1
34 21 Chris Bristol 310 4 3 1
35 25 Jeremy Clark 307 4 3 1
36 15 Glenn Sullivan 299 5 4 2
37 42 Landon Cassill 281 2 2 1 1
38 21 Antonio Pérez 264 3 3 1
39 85 Rob Humphreys 259 4 3 2
40 24 Patrick Dupree 243 3 3 1
41 39 Dustin Delaney 233 2 2
42 3 John Wes Townley 228 2 2 1 1
43 9 Tim Andrews 227 2 2 1 1
44 76 Jason Cochran 221 2 2 1
45 33 Tim McCreadie 210 2 2 1 1 1
46 91 Ben Stancill 209 2 2 1
47 11 Laine Chase 206 2 2
48 15 Brian Ickler 206 2 2 1
49 14 Joe Masessa 201 3 3
50 7 Pierre Bourque 181 4 2 1
51 3 Jeffrey Oakley 179 2 2 1
52 3 Stephen Berry 179 2 2
53 47 Kelly Moore 158 2 2 1
54 45 Brian Hoar 155 1 1 1 1
55 06 Ryan Seaman 152 2 2 2
56 74 Ryan Moore 142 1 1 1
57 53 Steve Park 142 1 1 1
58 88 Larry Moloney 134 1 1 1
59 28 A. J. Lane 131 2 2 1
60 75 Tim Cowen 129 3 1 1
61 2 Josh Wise 127 1 1
62 3 Nicholas Formosa 118 1 1
63 88 Mike Gallo 112 1 1
64 23 Casey Wyatt 110 2 1 1
65 59 Jonathan Cash 107 2 1
66 00 Trevor Bayne 104 2 1 1
67 28 Kevin Leicht 103 1 1
68 81 Mark McFarland 102 1 1
69 8 Skip McCord 100 1 1
70 3 Blair Addis 99 3 1
71 76 Jerick Johnson 87 3 1
72 05 Guy Pavageau 79 1 1 1
73 13 Garrett Liberty 70 1 1 1
74 29 Scott Lynch 61 1 1 1

Announcing the quantum-steampunk creative-writing course!

0
Announcing the quantum-steampunk creative-writing course!

Why not run a quantum-steampunk creative-writing course?

Quantum steampunk, as Quantum Frontiers regulars know, is the aesthetic and spirit of a growing scientific field. Steampunk is a subgenre of science fiction. In it, futuristic technologies invade Victorian-era settings: submarines, time machines, and clockwork octopodes populate La Belle Èpoque, a recently liberated Haiti, and Sherlock Holmes’s London. A similar invasion characterizes my research field, quantum thermodynamics: thermodynamics is the study of heat, work, temperature, and efficiency. The Industrial Revolution spurred the theory’s development during the 1800s. The theory’s original subject—nineteenth-century engines—were large, were massive, and contained enormous numbers of particles. Such engines obey the classical mechanics developed during the 1600s. Hence thermodynamics needs re-envisioning for quantum systems. To extend the theory’s laws and applications, quantum thermodynamicists use mathematical and experimental tools from quantum information science. Quantum information science is, in part, the understanding of quantum systems through how they store and process information. The toolkit is partially cutting-edge and partially futuristic, as full-scale quantum computers remain under construction. So applying quantum information to thermodynamics—quantum thermodynamics—strikes me as the real-world incarnation of steampunk.

But the thought of a quantum-steampunk creative-writing course had never occurred to me, and I hesitated over it. Quantum-steampunk blog posts, I could handle. A book, I could handle. Even a short-story contest, I’d handled. But a course? The idea yawned like the pitch-dark mouth of an unknown cavern in my imagination.

But the more I mulled over Edward Daschle’s suggestion, the more I warmed to it. Edward was completing a master’s degree in creative writing at the University of Maryland (UMD), specializing in science fiction. His mentor Emily Brandchaft Mitchell had sung his praises via email. In 2023, Emily had served as a judge for the Quantum-Steampunk Short-Story Contest. She works as a professor of English at UMD, writes fiction, and specializes in the study of genre. I reached out to her last spring about collaborating on a grant for quantum-inspired art, and she pointed to her protégé.

Who won me over. Edward and I are co-teaching “Writing Quantum Steampunk: Science-Fiction Workshop” during spring 2025.

Announcing the quantum-steampunk creative-writing course!

The course will alternate between science and science fiction. Under Edward’s direction, we’ll read and discuss published fiction. We’ll also learn about what genres are and how they come to be. Students will try out writing styles by composing short stories themselves. Everyone will provide feedback about each other’s writing: what works, what’s confusing, and opportunities for improvement. 

The published fiction chosen will mirror the scientific subjects we’ll cover: quantum physics; quantum technologies; and thermodynamics, including quantum thermodynamics. I’ll lead this part of the course. The scientific studies will interleave with the story reading, writing, and workshopping. Students will learn about the science behind the science fiction while contributing to the growing subgenre of quantum steampunk.

We aim to attract students from across campus: physics, English, the Jiménez-Porter Writers’ House, computer science, mathematics, and engineering—plus any other departments whose students have curiosity and creativity to spare. The course already has three cross-listings: Arts and Humanities 270, Physics 299Q, Computer Science 298Q, and Chemistry 299Q. More may join the list, and we’re petitioning to satisfy General Education requirements.1 Undergraduate and graduate students are welcome. QuICS—the Joint Center for Quantum Information and Computer Science, my home base—is paying Edward’s salary through a seed grant. Ross Angelella, the director of the Writers’ House, arranged logistics and doused us with enthusiasm. I’m proud of how organizations across the university are uniting to support the course.

The diversity we seek, though, poses a challenge. The course lacks prerequisites, so I’ll need to teach at a level comprehensible to the non-science students. I’d enjoy doing so, but I’m concerned about boring the science students. Ideally, the science students will help me teach, while the non-science students will challenge us with foundational questions that force us to rethink basic concepts. Also, I hope that non-science students will galvanize discussions about ethical and sociological implications of quantum technologies. But how can one ensure that conversation will flow?

This summer, Edward and I traded candidate stories for the syllabus. Based on his suggestions, I recommend touring science fiction under an expert’s guidance. I enjoyed, for a few hours each weekend, sinking into the worlds of Ted Chiang, Ursula K. LeGuinn, N. K. Jemison, Ken Liu, and others. My scientific background informed my reading more than I’d expected. Some authors, I could tell, had researched their subjects thoroughly. When they transitioned from science into fiction, I trusted and followed them. Other authors tossed jargon into their writing but evidenced a lack of deep understanding. One author nailed technical details about quantum computation, initially impressing me, but missed the big picture: his conflict hinged on a misunderstanding about entanglement. I see all these stories as affording opportunities for learning and teaching, in different ways.

Students can begin registering for “Writing Quantum Steampunk: Science-Fiction Workshop” on October 24. We can offer only 15 seats, due to Writers’ House standards, so secure yours as soon as you can. Part of me still wonders how the Hilbert space I came to be co-teaching a quantum-steampunk creative-writing course.2 But I look forward to reading with you next spring!

1We expect the course to satisfy the requirement Distributive Studies: Scholarship in Practice (DSSP), but check back for the verdict.

2A Hilbert space is a mathematical object that represents a quantum system. But you needn’t know that to succeed in the course.

DC Circuit

0
DC Circuit

A direct current (DC) circuit is an electrical circuit in which the electric current flows in one direction. A standard battery is used as a source of current that powers the circuit.

Ohms’s Law in DC Circuit

The flow of direct current is governed by Ohm’s Law, which states that the current (I) flowing through a conductor is directly proportional to the voltage (V) applied across it and inversely proportional to the resistance (R) of the conductor. This relationship can be represented by the equation:

I = V/R

Types of DC Circuit

In a DC circuit, components or “loads” can be connected in two fundamental ways: series and parallel. Each type of connection affects the behavior of current and voltage differently.

Series Circuit

In a series circuit, all components are connected end-to-end, forming a single path for the current to flow. If one component fails or is disconnected, the entire circuit is interrupted, and the current stops flowing.

Current

The same current flows through all components in the series. It means the current remains constant, regardless of the number of components:

\[ I_{total} = I_1 = I_2 = I_3 = \dots  \]

Voltage 

The total voltage in the circuit is the sum of the voltage drops across each component. It follows from Kirchhoff’s Voltage Law (KVL):

\[ V_{total} = V_1 + V_2 + V_3 + \dots  \]

A detailed description of Kirchhoff’s Law can be found here.

Resistance

The total resistance in a series circuit is the sum of the individual resistances and is given by:

\[ R_{total} = R_1 + R_2 + R_3 + \dots \]

DC Circuit

Example Problem: Consider three resistors connected in series with a 12 V battery: R1 = 2 Ω, R2 = 3 Ω, and R3 = 5 Ω. What is the current flowing in the circuit?

Solution

Given

V = 12 V, R1 = 2 Ω, R2 = 3 Ω, and R3 = 5 Ω

The total resistance is:

Rtotal = 2 + 3 + 5 = 10 Ω

Using Ohm’s Law, the total current is:

\[ I = \frac{V_{total}}{R_{total}} = \frac{12 \, V}{10 \, \Omega} = 1.2 \, A \]

The current of 1.2 A flows through each resistor.

Parallel Circuits

In a parallel circuit, components are connected across the same two points, creating multiple paths for the current to flow. If one component fails or is disconnected, the other paths remain active, allowing current to continue flowing through the remaining components.

Voltage

The voltage across each component in a parallel circuit is the same and equal to the total voltage applied by the source:

\[ V_{total} = V_1 = V_2 = V_3 = \dots \]

Current

The total current in the circuit is the sum of the currents through each parallel branch. It follows from Kirchhoff’s Current Law (KCL):

\[ I_{total} = I_1 + I_2 + I_3 + \dots \]

Resistance

The total resistance of a parallel circuit is less than the smallest individual resistance. The reciprocal of the total resistance is the sum of the reciprocals of the individual resistances:

\[ \frac{1}{R_{total}} = \frac{1}{R_1} + \frac{1}{R_2} + \frac{1}{R_3} + \dots \]

DC Parallel Circuit

Example Problem: Consider three resistors connected in parallel with a 12 V battery: R1 ​= 2 Ω, R2 = 3 Ω and R3 = 6 Ω. What is the total current in the circuit?

Solution

Given

V = 12 V, R1 = 2 Ω, R2 = 3 Ω, and R3 = 6 Ω

The total resistance is:

\[ \frac{1}{R_{total}} = \frac{1}{2} + \frac{1}{3} + \frac{1}{6} = 1 \, \Omega

Using Ohm’s Law, the total current is:
\[ I_{total} = \frac{V_{total}}{R_{total}} = \frac{12 \, V}{1 \, \Omega} = 12 \,A

The current of 12 A divides among the branches, with more current flowing through paths of lower resistance.

The post DC Circuit appeared first on Science Facts.

Electrical sutures accelerate wound healing – Physics World

0
Electrical sutures accelerate wound healing – Physics World


Electrical sutures accelerate wound healing – Physics World


Skip to main content


Electrical sutures accelerate wound healing – Physics World

Discover more from Physics World


Copyright © 2024 by IOP Publishing Ltd and individual contributors

What Is an Oxygen Detector Spacer?

0
What Is an Oxygen Detector Spacer?

What Is an Oxygen Detector Spacer?What Is an Oxygen Detector Spacer?

What Is an Oxygen Detector Spacer?

They exist typically inaugurated between the O2 detector and the exhaust manifold or downpipe. The structure process of O2 detector spacers changes, counting on the precise automobile and spacer placement.

Generally, they exist threaded or included onto the O2 detector, completing a gap or length between the detector and the exhaust streamlet.

Oxygen sensor spacers, likewise known as oxygen detector spacers or O2 detector attachments, are undersized motorized machines created to modify the assignments of the oxygen (O2) detector in an automobile’s exhaust procedure.

Further, they are glorified as possible answers for “inspection machine” lights rendered by O2 detector mistakes.

While these advantages exist often asserted, their significance may deviate counting on the specific automobile, its machine managing strategy, and further aspects. Some spacers feature built-in motivations or further elements to exploit the detector’s homework.

The immediate position of O2 detector spacers is to change the feedback delivered by the O2 detector to the automobile’s machine management unit.

The O2 detector recreates an important role in surveying the oxygen stations in the exhaust gases, which enables the ECU to resolve the optimal air-to-fuel ratio for the explosion. Similarly, the legality of utilizing O2 detector spacers must exist carefully evaluated to confirm submission with emissions restrictions and the associated permitted substances.

Proponents of O2 detector spacers commandeer several advantages associated with their service. The numerous central assertion is that spacers can change the O2 detector lessons to complete a more wasted air-to-fuel proportion, which some acknowledge can output boosted horsepower, enhanced power economizing, and sweetened throttle answer.

Also, Read: Should I Check My Oil When The Engine Is Hot or Cold? | How to Check Oil in a Car in Some Steps

Do Oxygen Detector Spacers Work?

Nonetheless, the advancement intention portion counts on the automobile class and the height of the spacer utilized. Besides, it’s necessary to guarantee that the automobile obeys provincial emissions restrictions.

In some possibilities, the growth in energy economizing can be the tiniest. Besides, O2 detector spacers can boost exhaust emissions, so it’s necessary to guarantee that the automobile obeys provincial emissions restrictions.

Nonetheless, it’s necessary to explore the class of automobile and spacer size before seating them, as the piece of advancement will change depending on the circumstances.

The quick response is yes, O2 detector spacers can enhance machine interpretation and energy economizing.

Overall, O2 detector spacers can be fee-sufficient to enhance machine interpretation and energy scrimping.

1. Takes Out The Oxygen Sensor

Therefore, the sensor intention cannot discern the improved oxygen station in the tube. The spacer intention accepts the oxygen sensor from the exhaust tube. Thus, the inspection motor light choice termination is illuming.

2. Locks Open Loops

This advanced fragment of oxygen will expand the fuel-to-air ratio, forming an unobstructed loop. As a consequence, this intention initiates the inspection machine light to wink.

Hydrocarbons of gasoline again cause an immense portion of dampness. The spacer intention reads the gaunt shape in the exhaust streamlet and completes the open loop.

3. Read Average Status Of CO2

The Engine Control Unit volition noticed it as a defect and triggered the assessment machine light. Occasionally, this expanded gas flow will produce the oxygen sensor to discern a developed status of carbon dioxide.

Then the sensor spacer will read the average status of carbon dioxide and choice improve this problem.

4. Passes Emission Examination

Consequently, connecting a sensor spacer downstream choice support passes the emission examination. Especially the downstream sensor scans the cat output and whether the voltage stays steady.

5. CAT Efficacy Test

The sensor spacer intercepts gases from the cat and from getting the sensor. Thus, it intention hand the cat usefulness test.

Naturally, ECU intention stands confident about a functional catalytic converter (cat) when the downstream voltage is flatline somewhere about 450mV.

Consequently, the downstream voltage choice was arranged at about 450 mV, revealing the cat’s force.

6. Energy Economy

This exists fantastic for energy economizing. When you employ an oxygen spacer upstream, it intentionally reads the oxygen status at a decreased status. To reimburse for this, it intention depend on the air power ratio.

7. Tricks the ECU

Therefore, it takes a period for the sensor to discern the modifications in the gaseous combination. Occasionally, operating an oxygen sensor spacer hinders the instant reading power of the sensor. Due to this slow variation in the result stream reading, the ECU presumes that the cat is working appropriately.

8. Solves the CAT Efficacy Mistake

Otherwise, your strength maintains to encounter an efficiency mistake in the cat. The post-cat sensor must read more worn than the pre-cat oxygen sensor to settle this matter.

The center and pre-cat oxygen sensor assist should have significant difference alignments. And an oxygen sensor spacer in the post-cat exhaust tube translates this problem.

Also, Read: Can You Wax Your Car Too Much? | Some Reasons Why You Should Wax Your Car

Functions of the Oxygen Sensor Spacer

Functions of the Oxygen Sensor SpacerFunctions of the Oxygen Sensor Spacer

The leading position of it is to complete the unrestricted loop and troubleshoot the spark pin by the diagnostic machine. Additional than this, it is likewise employed in the pursuit.

1. Detach the Oxygen Sensor

The spacer disconnects the oxygen sensor from the exhaust tube so that the sensor intention does not exist competent to notice the high oxygen status in the stripe. Therefore, the assessment machine’s light intention contains illuminating.

2. Lock the Open Loops

As a development, this generates the machine light to flash. Hydrocarbons from gasoline again force surplus dampness, and this improved part of oxygen raises the power into the air, forming an empty loop.

So the spacer reads the creep state in the drain and approaches the unobstructed loop.

3. Observe the Correct Volume of Carbon Dioxide

The Engine Control Unit (ECU) catches a blemish and disturbs the assessment machine light. Occasionally the updraft demands the oxygen sensor to discern the extended status of carbon dioxide.

The area sensor reads the accurate amount of carbon dioxide and repairs this problem at that location.

4. Saves Fuel

This exists exemplary for energy conservation.

Employing an oxygen spacer beyond the dampness story reads lowers oxygen stations. To reimburse for this, it pauses the air-energy ratio.

Also, Read: Is Washing A Car With A Pressure Washer Safe? | How to Use a Pressure Washer to Clean Your Car

What Are The Oxygen Sensor Spacer Installation Procedures?

Thus, you can establish the sensor spacer by obeying occasional, straightforward steps. The building function of the oxygen sensor spacer is concise.

1. Let The Engine Cool Down

If you drive the automobile, wait 30 min until it evolves cold. You can’t persist with the methodology if the machine exists nonetheless desirable. The oxygen sensor is commonly connected to the exhaust procedure, and it willpower obtain hot when the machine is operating or hot.

2. Lifting The Auto

This intention completes sufficient space beneath the auto so you can proceed efficiently there. You ought to lift them by utilizing a jack. Construct infallible you are jacking it appropriately, and the jack bracket is sturdy.

3. Locating The Oxygen Sensor

Normally, an automobile can contain one to considerable oxygen sensors. If your automobile includes two oxygen sensors, you intention discover one around the machine cylinder.

Now, you maintain to encounter the oxygen sensor. A raven and stout wire intention arrive outward from that domain. Now, you can effortlessly access the oxygen sensor around the Catalytic converter.

Another intention exists someplace near the catalytic converter on the exhaust manifold.

Naturally, your choice maintain to fasten oxygen sensor spacers on the rearward oxygen sensor. Therefore, creeping down underneath the automobile, you intentionally discover a spark-pin-like element.

4. Disconnecting The Sensor

Employ a twisting and rotate it anti-clockwise to sever it from the procedure. You can likewise employ a heat gun to heat its cables and ground to complete the reference yield.

Periodically, the sensor can exist adhered, which is hard to remove. To unfasten the sensor from the exhaust manifold, you control to unscrew the sensor.

You can involve any intelligent petroleum on the sensor to unravel this matter. Then, you intend to wait 5-10 minutes, and the lubricant’s intention operates as a lubricating mechanism.

5. Establishing The Sensor Spacer

Before inaugurating the spacers, you control to seal up the tack which connects to the catalytic converter. Nowadays, keep circling it clockwise to tense the extension. After that, operate a wrench to complete the extension firm.

In this manner, your intention facilitates the gamble of it dropping inside the exhaust. Nowadays, behind dismissing the sensor, you ought to establish the sensor spacer on the bank-2 exhaust tube. Position the spacer on the pinpoint where the oxygen sensor was.

6. Attach The Oxygen Sensor

While extracting the sensor, you circled it anti-clockwise. Therefore, you must spin it clockwise while binding it to the oxygen sensor spacer. Behind depending it until the previous cable, you have to operate a twisting to tense its branch.

Also, Read: What Is a Car Air Filter? | The Benefits of a Clean Engine Air Filter

Can Oxygen Detector Spacer Cause Problems?

Inaugurating an oxygen detector spacer on the exhaust tube may complete some penalties. Here exist those.

  • Occasionally, the automobile could handle in a too-lean shape which stands dangerous. If you establish the spacer before the cat, it intends to maintain your vehicle’s air or energy ratio.
  • You may likewise experience a loss in the torque of the subordinate back
  • This may generate powerful harm to your motor in destiny. Establishing the spacer intention misleads the ECU into considering that the cat exists, operating precisely when it exists not.
  • Although you can translate the inspection machine light point by this, it can ensure the factual situation is cracked
  • At this location, exhaust gas won’t arrive in communication with the detector Thus, if, for some unpredictable grounds, the air-fuel ratio differences, the detector intention does not feel that. Establishing an oxygen spacer is assembling a dead area in the exhaust tube. As a development, you intend to understand unresponsiveness or misfires from your automobile’s machine
  • This represents the front detector adhering to the posterior shape. 90° oxygen detector spacers stand sensitive to delivering a p2196 code. This transpires because 90° spacers determine the exhaust gas from contacting the center cat oxygen detector

Also, Read: How Often Should I Check My Car Tyre Pressure? | What Affects Tire Pressure

Conclusion

The main objective of an O2 sensor is to estimate the portion of oxygen in the exhaust gases, which permits the machine’s computer to complete adjustments for optimal fuel-to-air ratio.

So when temperatures decrease, the more inconsequential possibility is that these dimension choices are skewed due to increased heat stations reaching out of your machine.

Because the oxygen sensor spacer enables to decrease in prevailing exhaust gas temperatures, it can likewise support enhanced power economizing.

This indicates your automobile intention to employ more diminutive gas altogether, and you can maintain banknotes on power expenses over the duration.

Also, Read: Why Does My Car Make a Rattling Noise on Cold Start? | What Is a Cold Start?


Frequently Asked Questions (FAQ)

What Is an Oxygen Detector Spacer?

The O2 spacer extends the gap between the o2 sensor and the exhaust gases, with an increased gap, it will provide a lower Co2 reading. … However, 90% of the time they will work provided the original o2 sensor is not faulty.

What Are O2 Sensor Spacers?

This Spacer is designed to space the oxygen sensor out of the hot exhaust gases just enough that it helps eliminate the check engine light (CEL) that is caused by dying catalytic converters or catless exhausts. There are two versions available, Straight and 90 Degree Angled Spacer.

How Do 02 Sensor Spacers Work?

So, What do O2 sensor spacers do? Mainly, oxygen sensor spacers pull the oxygen sensor out from the exhaust pipe. As a result, the increased oxygen level in the exhaust flow can’t manipulate the oxygen sensor. Thus, the ECU keeps thinking everything is alright with the cat system.

What Do O2 Sensor Spacers Do?

The primary function of oxygen sensor spacers is to close the open loop and solve the check engine light flashing issue.

Can O2 Sensor Spacer Cause Problems

If you put the spacer on the upstream sensor it would see the reduced O2 as a rich condition and compensate by leaning out the AFR. That might be better for the economy but also a possible risk of bad things happening if too lean.


Like this post? Share it with your friends!

Suggested Read –